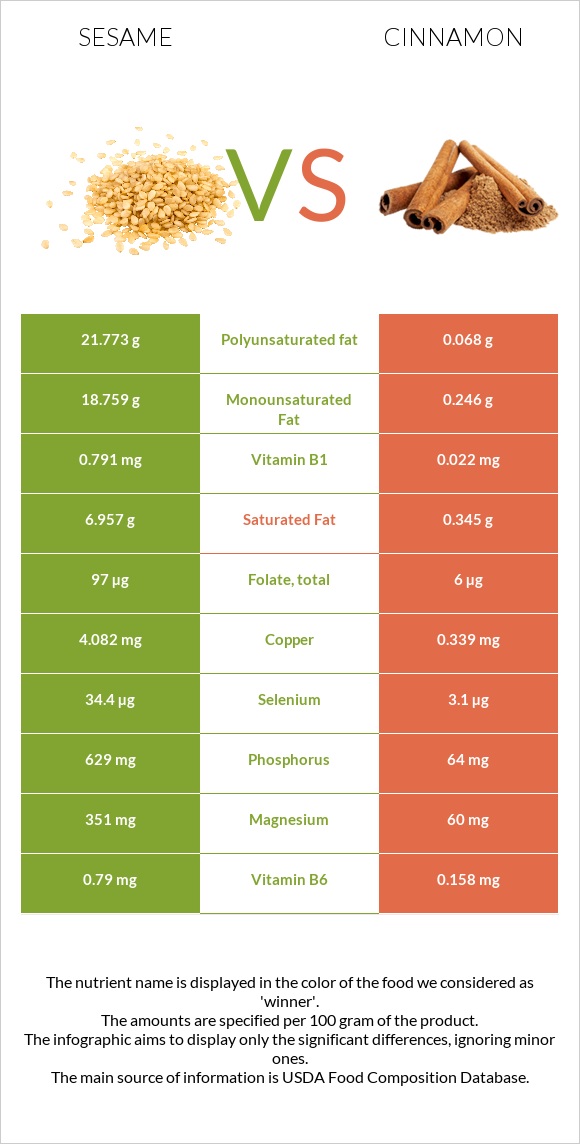
Summary of differences between sesame and cinnamon Sesame has more copper, phosphorus, iron, magnesium, vitamin B1, selenium, zinc, and vitamin B6, while cinnamon has more manganese and fiber. Cinnamon covers your daily need for manganese, 652% more than sesame. Sesame contains 36 times more vitamin B1 than cinnamon. While sesame contains 0.791mg of vitamin B1, cinnamon contains only 0.022mg. These are the specific foods used in this comparison Seeds, sesame seeds, whole, dried and Spices, cinnamon, ground .
Infographic
Mineral Comparison
Mineral comparison score is based on the number of minerals by which one or the other food is richer. The "coverage" charts below show how much of the daily needs can be covered by 300 grams of the food.
6
100 g
300 g
1 tbsp - 9g 1 cup - 144g
Magnesium
Magnesium
Calcium
Calcium
Potassium
Potassium
Iron
Iron
Copper
Copper
Zinc
Zinc
Phosphorus
Phosphorus
Sodium
Sodium
Manganese
Manganese
Selenium
Selenium
251%
293%
41%
546%
1361%
211%
270%
1.4%
321%
188%
1
100 g
300 g
0.25 tsp - 0.5g 1 tbsp - 7.8g
Magnesium
Magnesium
Calcium
Calcium
Potassium
Potassium
Iron
Iron
Copper
Copper
Zinc
Zinc
Phosphorus
Phosphorus
Sodium
Sodium
Manganese
Manganese
Selenium
Selenium
43%
301%
38%
312%
113%
50%
27%
1.3%
2278%
17%
Vitamin Comparison
Vitamin comparison score is based on the number of vitamins by which one or the other food is richer. The "coverage" charts below show how much of the daily needs can be covered by 300 grams of the food.
5
100 g
300 g
1 tbsp - 9g 1 cup - 144g
Vitamin C
Vit. C
Vitamin D
Vit. D
Vitamin A
Vit. A
Vitamin E
Vit. E
Vitamin B1
Vit. B1
Vitamin B2
Vit. B2
Vitamin B3
Vit. B3
Vitamin B5
Vit. B5
Vitamin B6
Vit. B6
Vitamin B12
Vit. B12
Vitamin K
Vit. K
Folate
Folate
0%
0%
0%
5%
198%
57%
85%
3%
182%
0%
0%
73%
5
100 g
300 g
0.25 tsp - 0.5g 1 tbsp - 7.8g
Vitamin C
Vit. C
Vitamin D
Vit. D
Vitamin A
Vit. A
Vitamin E
Vit. E
Vitamin B1
Vit. B1
Vitamin B2
Vit. B2
Vitamin B3
Vit. B3
Vitamin B5
Vit. B5
Vitamin B6
Vit. B6
Vitamin B12
Vit. B12
Vitamin K
Vit. K
Folate
Folate
13%
0%
5%
46%
5.5%
9.5%
25%
21%
36%
0%
78%
4.5%
All nutrients comparison - raw data values
Nutrient
DV% diff.
Manganese
2.46mg
17.466mg
652%
Copper
4.082mg
0.339mg
416%
Fiber
11.8g
53.1g
165%
Polyunsaturated fat
21.773g
0.068g
145%
Phosphorus
629mg
64mg
81%
Iron
14.55mg
8.32mg
78%
Fats
49.67g
1.24g
75%
Magnesium
351mg
60mg
69%
Vitamin B1
0.791mg
0.022mg
64%
Selenium
34.4µg
3.1µg
57%
Zinc
7.75mg
1.83mg
54%
Vitamin B6
0.79mg
0.158mg
49%
Monounsaturated fat
18.759g
0.246g
46%
Saturated fat
6.957g
0.345g
30%
Protein
17.73g
3.99g
27%
Vitamin K
0µg
31.2µg
26%
Folate
97µg
6µg
23%
Vitamin B3
4.515mg
1.332mg
20%
Carbs
23.45g
80.59g
19%
Calories
573kcal
247kcal
16%
Vitamin B2
0.247mg
0.041mg
16%
Vitamin E
0.25mg
2.32mg
14%
Vitamin B5
0.05mg
0.358mg
6%
Vitamin C
0mg
3.8mg
4%
Calcium
975mg
1002mg
3%
Choline
25.6mg
11mg
3%
Vitamin A
0µg
15µg
2%
Potassium
468mg
431mg
1%
Fructose
1.11g
1%
Protein per 100 calories
3.1g
1.6g
N/A
Calories per 10 g protein
323kcal
619kcal
N/A
Weight per 100 calories
17g
40g
N/A
Unsaturated / Saturated Fat ratio
5.8
0.91
N/A
Net carbs
11.65g
27.49g
N/A
Sugar
0.3g
2.17g
N/A
Sodium
11mg
10mg
0%
Tryptophan
0.388mg
0.049mg
0%
Threonine
0.736mg
0.136mg
0%
Isoleucine
0.763mg
0.146mg
0%
Leucine
1.358mg
0.253mg
0%
Lysine
0.569mg
0.243mg
0%
Methionine
0.586mg
0.078mg
0%
Phenylalanine
0.94mg
0.146mg
0%
Valine
0.99mg
0.224mg
0%
Histidine
0.522mg
0.117mg
0%
Omega-3 - ALA
0.011g
N/A
Macronutrient Comparison
Macronutrient breakdown side-by-side comparison
3
18%
50%
23%
5%
4%
Protein:
17.73 g
Fats:
49.67 g
Carbs:
23.45 g
Water:
4.69 g
Other:
4.46 g
2
4%
81%
11%
4%
Protein:
3.99 g
Fats:
1.24 g
Carbs:
80.59 g
Water:
10.58 g
Other:
3.6 g
Contains
more
Protein Protein
+344.4%
Contains
more
Fats Fats
+3905.6%
Contains
more
Other Other
+23.9%
Contains
more
Carbs Carbs
+243.7%
Contains
more
Water Water
+125.6%
Fat Type Comparison
Fat type breakdown side-by-side comparison
2
15%
40%
46%
Saturated fat:
Sat. Fat
6.957 g
Monounsaturated fat:
Mono. Fat
18.759 g
Polyunsaturated fat:
Poly. Fat
21.773 g
1
52%
37%
10%
Saturated fat:
Sat. Fat
0.345 g
Monounsaturated fat:
Mono. Fat
0.246 g
Polyunsaturated fat:
Poly. Fat
0.068 g
Contains
more
Mono. Fat Monounsaturated fat
+7525.6%
Contains
more
Poly. Fat Polyunsaturated fat
+31919.1%
Contains
less
Sat. Fat Saturated fat
-95%