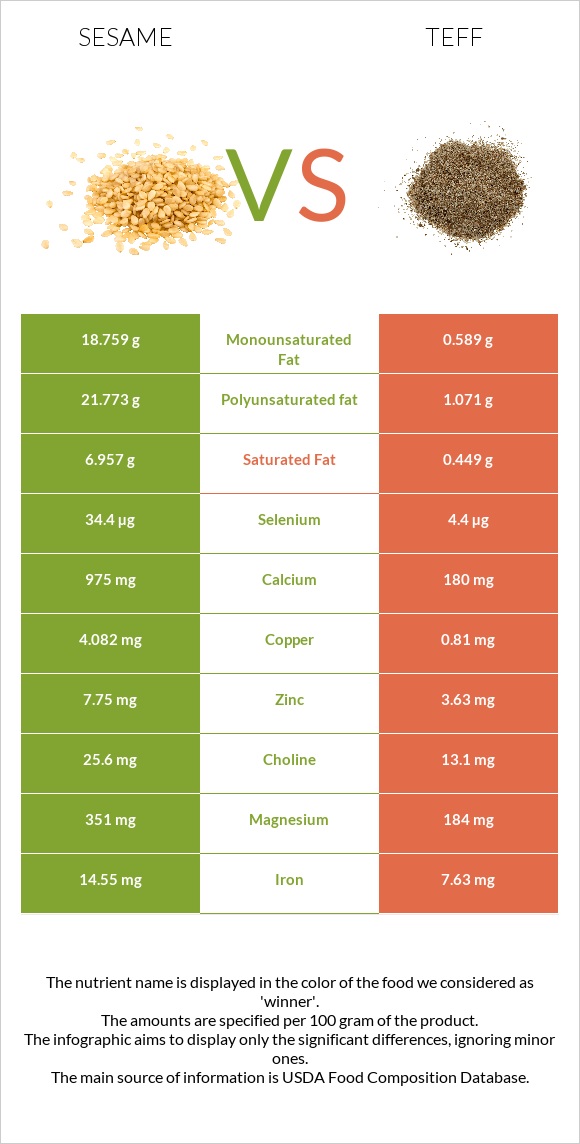
A recap on the differences between sesame and teff Sesame has more copper, iron, calcium, selenium, magnesium, zinc, vitamin B1, and phosphorus; however, teff is higher in manganese. Sesame covers your daily copper needs 364% more than teff. Teff contains 15 times less saturated fat than sesame. Sesame contains 6.957g of saturated fat, while teff contains 0.449g. Food varieties used in this article are Seeds, sesame seeds, whole, dried and Teff, uncooked .
Infographic
Mineral Comparison
Mineral comparison score is based on the number of minerals by which one or the other food is richer. The "coverage" charts below show how much of the daily needs can be covered by 300 grams of the food.
7
100 g
300 g
1 tbsp - 9g 1 cup - 144g
Magnesium
Magnesium
Calcium
Calcium
Potassium
Potassium
Iron
Iron
Copper
Copper
Zinc
Zinc
Phosphorus
Phosphorus
Sodium
Sodium
Manganese
Manganese
Selenium
Selenium
251%
293%
41%
546%
1361%
211%
270%
1.4%
321%
188%
1
100 g
300 g
1 cup - 193g
Magnesium
Magnesium
Calcium
Calcium
Potassium
Potassium
Iron
Iron
Copper
Copper
Zinc
Zinc
Phosphorus
Phosphorus
Sodium
Sodium
Manganese
Manganese
Selenium
Selenium
131%
54%
38%
286%
270%
99%
184%
1.6%
1205%
24%
Vitamin Comparison
Vitamin comparison score is based on the number of vitamins by which one or the other food is richer. The "coverage" charts below show how much of the daily needs can be covered by 300 grams of the food.
5
100 g
300 g
1 tbsp - 9g 1 cup - 144g
Vitamin C
Vit. C
Vitamin D
Vit. D
Vitamin A
Vit. A
Vitamin E
Vit. E
Vitamin B1
Vit. B1
Vitamin B2
Vit. B2
Vitamin B3
Vit. B3
Vitamin B5
Vit. B5
Vitamin B6
Vit. B6
Vitamin B12
Vit. B12
Vitamin K
Vit. K
Folate
Folate
0%
0%
0%
5%
198%
57%
85%
3%
182%
0%
0%
73%
2
100 g
300 g
1 cup - 193g
Vitamin C
Vit. C
Vitamin D
Vit. D
Vitamin A
Vit. A
Vitamin E
Vit. E
Vitamin B1
Vit. B1
Vitamin B2
Vit. B2
Vitamin B3
Vit. B3
Vitamin B5
Vit. B5
Vitamin B6
Vit. B6
Vitamin B12
Vit. B12
Vitamin K
Vit. K
Folate
Folate
0%
0%
0%
1.6%
98%
62%
63%
57%
111%
0%
4.8%
0%
All nutrients comparison - raw data values
Nutrient
DV% diff.
Copper
4.082mg
0.81mg
364%
Manganese
2.46mg
9.24mg
295%
Polyunsaturated fat
21.773g
1.071g
138%
Iron
14.55mg
7.63mg
87%
Calcium
975mg
180mg
80%
Fats
49.67g
2.38g
73%
Selenium
34.4µg
4.4µg
55%
Monounsaturated fat
18.759g
0.589g
45%
Magnesium
351mg
184mg
40%
Zinc
7.75mg
3.63mg
37%
Vitamin B1
0.791mg
0.39mg
33%
Saturated fat
6.957g
0.449g
30%
Phosphorus
629mg
429mg
29%
Vitamin B6
0.79mg
0.482mg
24%
Folate
97µg
24%
Vitamin B5
0.05mg
0.942mg
18%
Carbs
23.45g
73.13g
17%
Fiber
11.8g
8g
15%
Starch
36.56g
15%
Calories
573kcal
367kcal
10%
Protein
17.73g
13.3g
9%
Vitamin B3
4.515mg
3.363mg
7%
Vitamin B2
0.247mg
0.27mg
2%
Vitamin K
0µg
1.9µg
2%
Choline
25.6mg
13.1mg
2%
Potassium
468mg
427mg
1%
Vitamin E
0.25mg
0.08mg
1%
Fructose
0.47g
1%
Protein per 100 calories
3.1g
3.6g
N/A
Calories per 10 g protein
323kcal
276kcal
N/A
Weight per 100 calories
17g
27g
N/A
Unsaturated / Saturated Fat ratio
5.8
3.7
N/A
Net carbs
11.65g
65.13g
N/A
Sugar
0.3g
1.84g
N/A
Sodium
11mg
12mg
0%
Tryptophan
0.388mg
0.139mg
0%
Threonine
0.736mg
0.51mg
0%
Isoleucine
0.763mg
0.501mg
0%
Leucine
1.358mg
1.068mg
0%
Lysine
0.569mg
0.376mg
0%
Methionine
0.586mg
0.428mg
0%
Phenylalanine
0.94mg
0.698mg
0%
Valine
0.99mg
0.686mg
0%
Histidine
0.522mg
0.301mg
0%
Omega-3 - ALA
0.135g
N/A
Macronutrient Comparison
Macronutrient breakdown side-by-side comparison
3
18%
50%
23%
5%
4%
Protein:
17.73 g
Fats:
49.67 g
Carbs:
23.45 g
Water:
4.69 g
Other:
4.46 g
2
13%
2%
73%
9%
2%
Protein:
13.3 g
Fats:
2.38 g
Carbs:
73.13 g
Water:
8.82 g
Other:
2.37 g
Contains
more
Protein Protein
+33.3%
Contains
more
Fats Fats
+1987%
Contains
more
Other Other
+88.2%
Contains
more
Carbs Carbs
+211.9%
Contains
more
Water Water
+88.1%
Fat Type Comparison
Fat type breakdown side-by-side comparison
2
15%
40%
46%
Saturated fat:
Sat. Fat
6.957 g
Monounsaturated fat:
Mono. Fat
18.759 g
Polyunsaturated fat:
Poly. Fat
21.773 g
1
21%
28%
51%
Saturated fat:
Sat. Fat
0.449 g
Monounsaturated fat:
Mono. Fat
0.589 g
Polyunsaturated fat:
Poly. Fat
1.071 g
Contains
more
Mono. Fat Monounsaturated fat
+3084.9%
Contains
more
Poly. Fat Polyunsaturated fat
+1933%
Contains
less
Sat. Fat Saturated fat
-93.5%