Shrimp vs. Lablab — In-Depth Nutrition Comparison
Compare
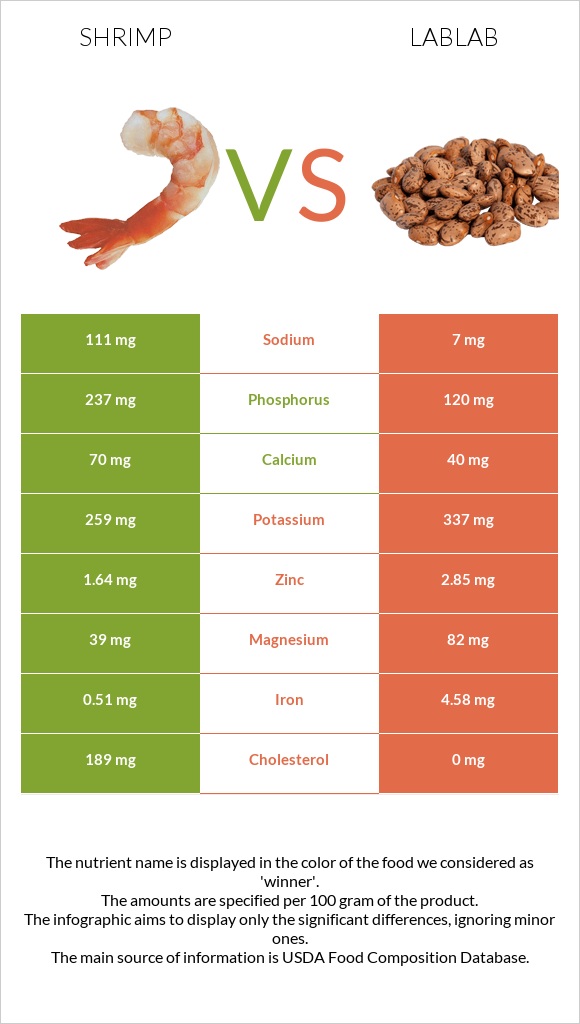
How are shrimp and lablab different?
- Shrimp is higher in phosphorus; however, lablab is richer in iron, manganese, zinc, and magnesium.
- Daily need coverage for cholesterol for shrimp is 63% higher.
- Shrimp contains 16 times more sodium than lablab. While shrimp contains 111mg of sodium, lablab contains only 7mg.
- Lablab has less cholesterol.
Crustaceans, shrimp, cooked (not previously frozen) and Hyacinth beans, mature seeds, cooked, boiled, without salt are the varieties used in this article.
Infographic
Infographic link
Mineral Comparison
Mineral comparison score is based on the number of minerals by which one or the other food is richer. The "coverage" charts below show how much of the daily needs can be covered by 300 grams of the food.
| Contains more CalciumCalcium | +75% |
| Contains more PhosphorusPhosphorus | +97.5% |
| Contains more MagnesiumMagnesium | +110.3% |
| Contains more PotassiumPotassium | +30.1% |
| Contains more IronIron | +798% |
| Contains more ZincZinc | +73.8% |
| Contains less SodiumSodium | -93.7% |
| Contains more ManganeseManganese | +1360.6% |
Vitamin Comparison
Vitamin comparison score is based on the number of vitamins by which one or the other food is richer. The "coverage" charts below show how much of the daily needs can be covered by 300 grams of the food.
All nutrients comparison - raw data values
| Nutrient |  |
 |
DV% diff. |
| Cholesterol | 189mg | 0mg | 63% |
| Iron | 0.51mg | 4.58mg | 51% |
| Protein | 23.98g | 8.14g | 32% |
| Vitamin B1 | 0.27mg | 23% | |
| Manganese | 0.033mg | 0.482mg | 20% |
| Phosphorus | 237mg | 120mg | 17% |
| Zinc | 1.64mg | 2.85mg | 11% |
| Magnesium | 39mg | 82mg | 10% |
| Carbs | 0.2g | 20.69g | 7% |
| Vitamin B5 | 0.316mg | 6% | |
| Sodium | 111mg | 7mg | 5% |
| Selenium | 2.8µg | 5% | |
| Copper | 0.379mg | 0.341mg | 4% |
| Calcium | 70mg | 40mg | 3% |
| Vitamin B2 | 0.037mg | 3% | |
| Vitamin B3 | 0.411mg | 3% | |
| Vitamin B6 | 0.037mg | 3% | |
| Potassium | 259mg | 337mg | 2% |
| Calories | 99kcal | 117kcal | 1% |
| Folate | 4µg | 1% | |
| Polyunsaturated fat | 0.079g | 0.245g | 1% |
| Fats | 0.28g | 0.58g | 0% |
| Net carbs | 0.2g | 20.69g | N/A |
| Trans fat | 0.002g | 0g | N/A |
| Saturated fat | 0.056g | 0.099g | 0% |
| Monounsaturated fat | 0.048g | 0.026g | 0% |
| Tryptophan | 0.068mg | 0% | |
| Threonine | 0.315mg | 0% | |
| Isoleucine | 0.39mg | 0% | |
| Leucine | 0.691mg | 0% | |
| Lysine | 0.556mg | 0% | |
| Methionine | 0.065mg | 0% | |
| Phenylalanine | 0.41mg | 0% | |
| Valine | 0.422mg | 0% | |
| Histidine | 0.233mg | 0% | |
| Omega-3 - EPA | 0.015g | N/A | |
| Omega-3 - DHA | 0.015g | N/A | |
| Omega-3 - ALA | 0.001g | N/A | |
| Omega-3 - DPA | 0.001g | N/A | |
| Omega-6 - Dihomo-gamma-linoleic acid | 0.001g | N/A | |
| Omega-6 - Eicosadienoic acid | 0.002g | N/A | |
| Omega-6 - Linoleic acid | 0.018g | N/A |
Macronutrient Comparison
Macronutrient breakdown side-by-side comparison
| Contains more ProteinProtein | +194.6% |
| Contains more FatsFats | +107.1% |
| Contains more CarbsCarbs | +10245% |
| Contains more OtherOther | +20.7% |
~equal in
Water
~69.13g
Fat Type Comparison
Fat type breakdown side-by-side comparison
| Contains less Sat. FatSaturated fat | -43.4% |
| Contains more Mono. FatMonounsaturated fat | +84.6% |
| Contains more Poly. FatPolyunsaturated fat | +210.1% |