Smoothie vs. Tea — In-Depth Nutrition Comparison
Compare
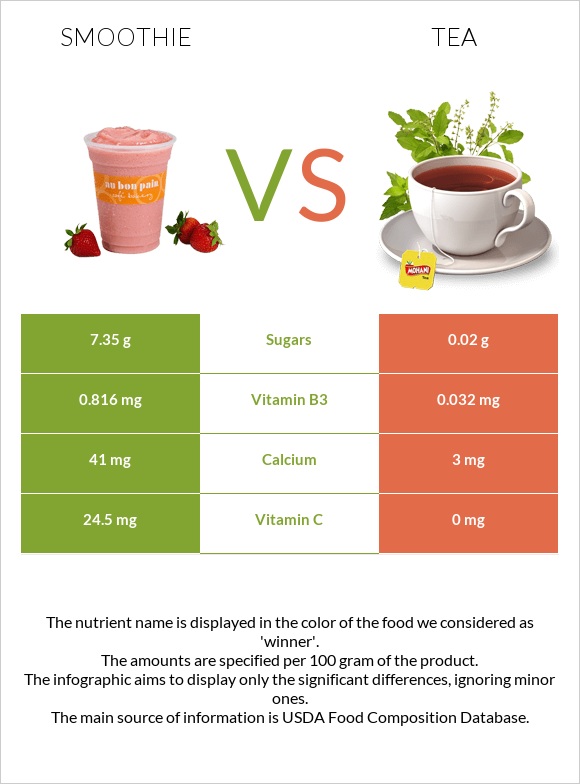
The main differences between smoothie and tea
- Smoothie is richer than tea in vitamin C, vitamin B12, vitamin A, and vitamin B6.
- Daily need coverage for vitamin C for smoothie is 27% higher.
- Tea contains less sugar.
- Tea has a lower glycemic index than smoothie.
Food types used in this article are Beverages, V8 SPLASH Smoothies, Strawberry Banana and Beverages, tea, instant, unsweetened, prepared with water.
Infographic
Infographic link
Mineral Comparison
Mineral comparison score is based on the number of minerals by which one or the other food is richer. The "coverage" charts below show how much of the daily needs can be covered by 300 grams of the food.
| Contains more CalciumCalcium | +1266.7% |
| Contains more PotassiumPotassium | +33.3% |
| Contains more IronIron | +1400% |
| Contains less SodiumSodium | -86.2% |
Vitamin Comparison
Vitamin comparison score is based on the number of vitamins by which one or the other food is richer. The "coverage" charts below show how much of the daily needs can be covered by 300 grams of the food.
| Contains more Vitamin CVitamin C | +∞% |
| Contains more Vitamin B3Vitamin B3 | +2450% |
| Contains more Vitamin B6Vitamin B6 | +8100% |
| Contains more Vitamin B12Vitamin B12 | +∞% |
All nutrients comparison - raw data values
| Nutrient |  |
 |
DV% diff. |
| Vitamin C | 24.5mg | 0mg | 27% |
| Manganese | 0.392mg | 17% | |
| Vitamin B12 | 0.24µg | 0µg | 10% |
| Vitamin B6 | 0.082mg | 0.001mg | 6% |
| Vitamin B3 | 0.816mg | 0.032mg | 5% |
| Calcium | 41mg | 3mg | 4% |
| Carbs | 8.16g | 0.17g | 3% |
| Caffeine | 11mg | 3% | |
| Calories | 37kcal | 1kcal | 2% |
| Protein | 1.22g | 0.06g | 2% |
| Iron | 0.15mg | 0.01mg | 2% |
| Copper | 0.011mg | 1% | |
| Sodium | 29mg | 4mg | 1% |
| Protein per 100 calories | 3.3g | 6g | N/A |
| Calories per 10 g protein | 303kcal | 167kcal | N/A |
| Weight per 100 calories | 270g | 10000g | N/A |
| Net carbs | 8.16g | 0.17g | N/A |
| Magnesium | 2mg | 0% | |
| Potassium | 24mg | 18mg | 0% |
| Sugar | 7.35g | 0.02g | N/A |
| Zinc | 0.01mg | 0% | |
| Phosphorus | 1mg | 0% | |
| Vitamin B2 | 0.003mg | 0% | |
| Vitamin B5 | 0.013mg | 0% | |
| Choline | 0.3mg | 0% |
Macronutrient Comparison
Macronutrient breakdown side-by-side comparison
| Contains more ProteinProtein | +1933.3% |
| Contains more CarbsCarbs | +4700% |
| Contains more OtherOther | +126.7% |
| Contains more WaterWater | +10.3% |
~equal in
Fats
~0g


