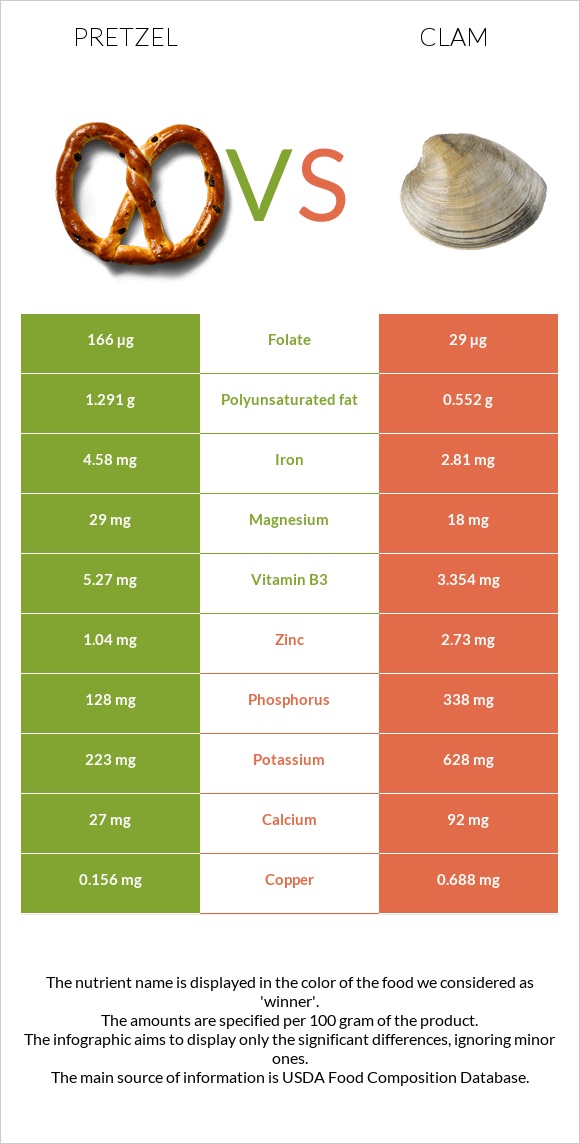
What are the main differences between pretzel and clam? Pretzel is richer in folate, vitamin B1, and iron, while clam is higher in vitamin B12, selenium, copper, phosphorus, vitamin C, and zinc. Clam's daily need coverage for vitamin B12 is 4120% higher. Clam has 6 times less folate than pretzel. Pretzel has 166µg of folate, while clam has 29µg. Pretzel has a higher glycemic index (83) than clam (27). We used Snacks, pretzels, hard, plain, salted and Mollusks, clam, mixed species, cooked, moist heat types in this comparison.
Infographic
Mineral Comparison
Mineral comparison score is based on the number of minerals by which one or the other food is richer. The "coverage" charts below show how much of the daily needs can be covered by 300 grams of the food.
2
100 g
300 g
1 oz - 28.35g 10 twists - 60g
Magnesium
Magnesium
Calcium
Calcium
Potassium
Potassium
Iron
Iron
Copper
Copper
Zinc
Zinc
Phosphorus
Phosphorus
Sodium
Sodium
Manganese
Manganese
Selenium
Selenium
21%
8.1%
20%
172%
52%
28%
55%
162%
132%
24%
6
100 g
300 g
3 oz - 85g 20 small - 190g
Magnesium
Magnesium
Calcium
Calcium
Potassium
Potassium
Iron
Iron
Copper
Copper
Zinc
Zinc
Phosphorus
Phosphorus
Sodium
Sodium
Manganese
Manganese
Selenium
Selenium
13%
28%
55%
105%
229%
74%
145%
157%
130%
349%
Vitamin Comparison
Vitamin comparison score is based on the number of vitamins by which one or the other food is richer. The "coverage" charts below show how much of the daily needs can be covered by 300 grams of the food.
5
100 g
300 g
1 oz - 28.35g 10 twists - 60g
Vitamin C
Vit. C
Vitamin D
Vit. D
Vitamin A
Vit. A
Vitamin E
Vit. E
Vitamin B1
Vit. B1
Vitamin B2
Vit. B2
Vitamin B3
Vit. B3
Vitamin B5
Vit. B5
Vitamin B6
Vit. B6
Vitamin B12
Vit. B12
Vitamin K
Vit. K
Folate
Folate
7%
0%
0%
9.4%
106%
77%
99%
19%
17%
0%
7%
125%
6
100 g
300 g
3 oz - 85g 20 small - 190g
Vitamin C
Vit. C
Vitamin D
Vit. D
Vitamin A
Vit. A
Vitamin E
Vit. E
Vitamin B1
Vit. B1
Vitamin B2
Vit. B2
Vitamin B3
Vit. B3
Vitamin B5
Vit. B5
Vitamin B6
Vit. B6
Vitamin B12
Vit. B12
Vitamin K
Vit. K
Folate
Folate
74%
0%
57%
0%
38%
98%
63%
41%
25%
12361%
0%
22%
All nutrients comparison - raw data values
Nutrient
DV% diff.
Vitamin B12
0µg
98.89µg
4120%
Selenium
4.4µg
64µg
108%
Copper
0.156mg
0.688mg
59%
Folate
166µg
29µg
34%
Protein
10.04g
25.55g
31%
Starch
72.58g
30%
Phosphorus
128mg
338mg
30%
Carbs
80.39g
5.13g
25%
Vitamin B1
0.424mg
0.15mg
23%
Vitamin C
2.1mg
22.1mg
22%
Cholesterol
0mg
67mg
22%
Iron
4.58mg
2.81mg
22%
Vitamin A
0µg
171µg
19%
Zinc
1.04mg
2.73mg
15%
Fiber
3.4g
0g
14%
Calories
384kcal
148kcal
12%
Potassium
223mg
628mg
12%
Vitamin B3
5.27mg
3.354mg
12%
Calcium
27mg
92mg
7%
Vitamin B2
0.332mg
0.426mg
7%
Vitamin B5
0.322mg
0.68mg
7%
Choline
29.5mg
5%
Polyunsaturated fat
1.291g
0.552g
5%
Magnesium
29mg
18mg
3%
Vitamin E
0.47mg
3%
Vitamin B6
0.074mg
0.11mg
3%
Fats
2.93g
1.95g
2%
Sodium
1240mg
1202mg
2%
Vitamin K
2.8µg
2%
Manganese
1.015mg
1mg
1%
Saturated fat
0.391g
0.188g
1%
Monounsaturated fat
0.727g
0.172g
1%
Protein per 100 calories
2.6g
17g
N/A
Calories per 10 g protein
382kcal
58kcal
N/A
Weight per 100 calories
26g
68g
N/A
Unsaturated / Saturated Fat ratio
5.2
3.9
N/A
Net carbs
76.99g
5.13g
N/A
Sugar
2.21g
N/A
Trans fat
0.004g
N/A
Tryptophan
0.097mg
0.286mg
0%
Threonine
0.25mg
1.099mg
0%
Isoleucine
0.407mg
1.112mg
0%
Leucine
0.757mg
1.798mg
0%
Lysine
0.257mg
1.909mg
0%
Methionine
0.177mg
0.576mg
0%
Phenylalanine
0.52mg
0.915mg
0%
Valine
0.48mg
1.116mg
0%
Histidine
0.22mg
0.49mg
0%
Fructose
0.31g
0%
Omega-3 - EPA
0g
0.138g
N/A
Omega-3 - DHA
0g
0.146g
N/A
Omega-3 - ALA
0.063g
N/A
Omega-3 - DPA
0g
0.104g
N/A
Omega-6 - Gamma-linoleic acid
0.001g
N/A
Omega-6 - Linoleic acid
1.223g
N/A
Macronutrient Comparison
Macronutrient breakdown side-by-side comparison
2
10%
3%
80%
3%
4%
Protein:
10.04 g
Fats:
2.93 g
Carbs:
80.39 g
Water:
3.13 g
Other:
3.51 g
3
26%
2%
5%
64%
4%
Protein:
25.55 g
Fats:
1.95 g
Carbs:
5.13 g
Water:
63.64 g
Other:
3.73 g
Contains
more
Fats Fats
+50.3%
Contains
more
Carbs Carbs
+1467.1%
Contains
more
Protein Protein
+154.5%
Contains
more
Water Water
+1933.2%
Fat Type Comparison
Fat type breakdown side-by-side comparison
2
16%
30%
54%
Saturated fat:
Sat. Fat
0.391 g
Monounsaturated fat:
Mono. Fat
0.727 g
Polyunsaturated fat:
Poly. Fat
1.291 g
1
21%
19%
61%
Saturated fat:
Sat. Fat
0.188 g
Monounsaturated fat:
Mono. Fat
0.172 g
Polyunsaturated fat:
Poly. Fat
0.552 g
Contains
more
Mono. Fat Monounsaturated fat
+322.7%
Contains
more
Poly. Fat Polyunsaturated fat
+133.9%
Contains
less
Sat. Fat Saturated fat
-51.9%