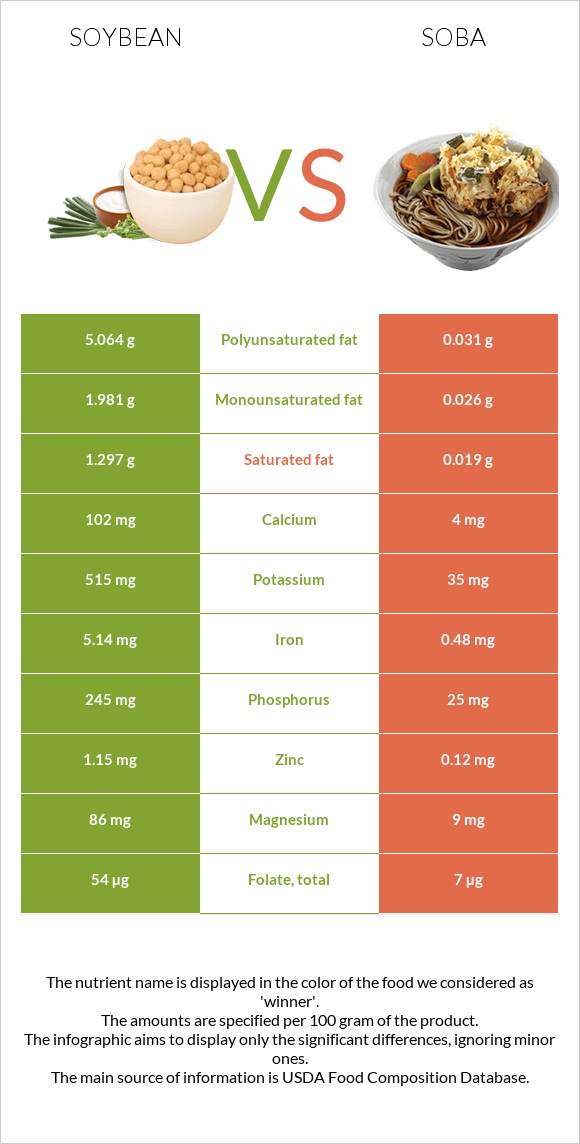
The main differences between soybeans and soba Soybeans are richer than soba in iron, copper, phosphorus, vitamin B2, manganese, magnesium, vitamin B6, potassium, folate, and calcium. Daily need coverage for iron for soybeans is 58% higher. Soybeans contain 51 times more copper than soba. Soybeans contain 0.407mg of copper, while soba contains 0.008mg. Soybeans have a lower glycemic index than soba. Food types used in this article are Soybeans, mature cooked, boiled, without salt and Noodles, japanese, soba, cooked .
Infographic
Mineral Comparison
Mineral comparison score is based on the number of minerals by which one or the other food is richer. The "coverage" charts below show how much of the daily needs can be covered by 300 grams of the food.
10
100 g
300 g
1 tbsp - 10.7g 1 cup - 172g
Magnesium
Magnesium
Calcium
Calcium
Potassium
Potassium
Iron
Iron
Copper
Copper
Zinc
Zinc
Phosphorus
Phosphorus
Sodium
Sodium
Manganese
Manganese
Selenium
Selenium
61%
31%
45%
193%
136%
31%
105%
0.13%
107%
40%
0
100 g
300 g
1 cup - 114g
Magnesium
Magnesium
Calcium
Calcium
Potassium
Potassium
Iron
Iron
Copper
Copper
Zinc
Zinc
Phosphorus
Phosphorus
Sodium
Sodium
Manganese
Manganese
Selenium
Selenium
6.4%
1.2%
3.1%
18%
2.7%
3.3%
11%
7.8%
49%
0%
Vitamin Comparison
Vitamin comparison score is based on the number of vitamins by which one or the other food is richer. The "coverage" charts below show how much of the daily needs can be covered by 300 grams of the food.
7
100 g
300 g
1 tbsp - 10.7g 1 cup - 172g
Vitamin C
Vit. C
Vitamin D
Vit. D
Vitamin A
Vit. A
Vitamin E
Vit. E
Vitamin B1
Vit. B1
Vitamin B2
Vit. B2
Vitamin B3
Vit. B3
Vitamin B5
Vit. B5
Vitamin B6
Vit. B6
Vitamin B12
Vit. B12
Vitamin K
Vit. K
Folate
Folate
5.7%
0%
0%
7%
39%
66%
7.5%
11%
54%
0%
48%
41%
2
100 g
300 g
1 cup - 114g
Vitamin C
Vit. C
Vitamin D
Vit. D
Vitamin A
Vit. A
Vitamin E
Vit. E
Vitamin B1
Vit. B1
Vitamin B2
Vit. B2
Vitamin B3
Vit. B3
Vitamin B5
Vit. B5
Vitamin B6
Vit. B6
Vitamin B12
Vit. B12
Vitamin K
Vit. K
Folate
Folate
0%
0%
0%
0%
24%
6%
9.6%
14%
9.2%
0%
0%
5.3%
All nutrients comparison - raw data values
Nutrient
DV% diff.
Iron
5.14mg
0.48mg
58%
Copper
0.407mg
0.008mg
44%
Polyunsaturated fat
5.064g
0.031g
34%
Phosphorus
245mg
25mg
31%
Protein
18.21g
5.06g
26%
Fiber
6g
24%
Manganese
0.824mg
0.374mg
20%
Vitamin B2
0.285mg
0.026mg
20%
Magnesium
86mg
9mg
18%
Vitamin K
19.2µg
16%
Vitamin B6
0.234mg
0.04mg
15%
Fats
8.97g
0.1g
14%
Potassium
515mg
35mg
14%
Selenium
7.3µg
13%
Folate
54µg
7µg
12%
Calcium
102mg
4mg
10%
Zinc
1.15mg
0.12mg
9%
Choline
47.5mg
9%
Saturated fat
1.297g
0.019g
6%
Vitamin B1
0.155mg
0.094mg
5%
Monounsaturated fat
1.981g
0.026g
5%
Calories
172kcal
99kcal
4%
Carbs
8.36g
21.44g
4%
Sodium
1mg
60mg
3%
Vitamin C
1.7mg
0mg
2%
Vitamin E
0.35mg
2%
Vitamin B3
0.399mg
0.51mg
1%
Vitamin B5
0.179mg
0.235mg
1%
Protein per 100 calories
11g
5.1g
N/A
Calories per 10 g protein
94kcal
196kcal
N/A
Weight per 100 calories
58g
101g
N/A
Unsaturated / Saturated Fat ratio
5.4
3
N/A
Net carbs
2.36g
21.44g
N/A
Sugar
3g
N/A
Tryptophan
0.242mg
0.072mg
0%
Threonine
0.723mg
0.177mg
0%
Isoleucine
0.807mg
0.195mg
0%
Leucine
1.355mg
0.33mg
0%
Lysine
1.108mg
0.214mg
0%
Methionine
0.224mg
0.072mg
0%
Phenylalanine
0.869mg
0.217mg
0%
Valine
0.831mg
0.249mg
0%
Histidine
0.449mg
0.119mg
0%
Macronutrient Comparison
Macronutrient breakdown side-by-side comparison
3
18%
9%
8%
63%
2%
Protein:
18.21 g
Fats:
8.97 g
Carbs:
8.36 g
Water:
62.55 g
Other:
1.91 g
2
5%
21%
73%
Protein:
5.06 g
Fats:
0.1 g
Carbs:
21.44 g
Water:
73.01 g
Other:
0.39 g
Contains
more
Protein Protein
+259.9%
Contains
more
Fats Fats
+8870%
Contains
more
Other Other
+389.7%
Contains
more
Carbs Carbs
+156.5%
Contains
more
Water Water
+16.7%
Fat Type Comparison
Fat type breakdown side-by-side comparison
2
16%
24%
61%
Saturated fat:
Sat. Fat
1.297 g
Monounsaturated fat:
Mono. Fat
1.981 g
Polyunsaturated fat:
Poly. Fat
5.064 g
1
25%
34%
41%
Saturated fat:
Sat. Fat
0.019 g
Monounsaturated fat:
Mono. Fat
0.026 g
Polyunsaturated fat:
Poly. Fat
0.031 g
Contains
more
Mono. Fat Monounsaturated fat
+7519.2%
Contains
more
Poly. Fat Polyunsaturated fat
+16235.5%
Contains
less
Sat. Fat Saturated fat
-98.5%