Soybean vs. Tofu — Health Impact and Nutrition Comparison


Summary
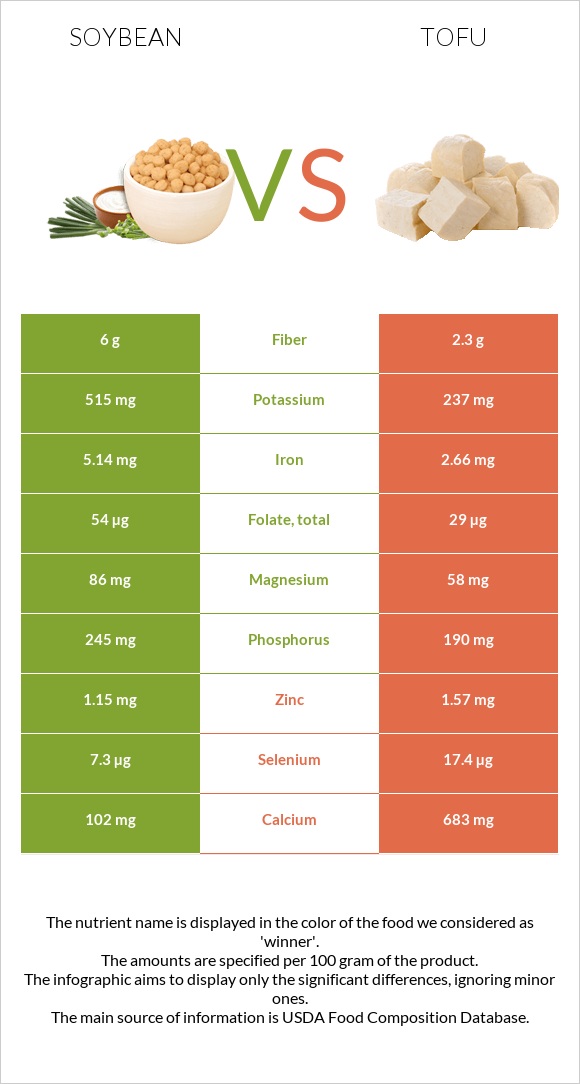
Soybeans are higher in iron, fiber, vitamins B2, B9, K, B6, potassium, phosphorus, and magnesium, while tofu is higher in calcium, selenium, and manganese.
Soybean and tofu have similar glycemic indexes and protein and fat amounts. However, tofu has lower sodium and sugar content.
Introduction
We'll discuss the main differences between soybean and tofu, focusing on their nutritional content and health impact.
Is Soybean the Same as Tofu?
Soybeans are a type of legume rich in protein and used in many food products. Tofu, also called bean curd, is made from soybeans by turning soy milk into a solid form using coagulation.
Tofu is made from soybeans, a coagulant like calcium sulfate or magnesium chloride, and water. These ingredients give tofu its smooth, firm texture, making it easy to cook. Soybeans can be eaten whole or processed into products like soy milk, but tofu is a specific food created from them.
Usage and Preparation
Soybeans can be consumed whole, roasted as a snack, or cooked in soups and stews. They are also processed into soy milk, flour, protein, and fermented products like miso, soy sauce, and tempeh. Tofu, made by coagulating soy milk and pressing the curds, is a staple in many dishes. It can be eaten raw, stir-fried, grilled, baked, or blended into smoothies.
Soybeans are valued for their high protein and fiber content, while tofu offers a softer texture and adapts well to diverse flavors, making both staples in plant-based diets (1).
Nutrition
The food types discussed in this article are cooked soybeans without salt and tofu prepared with calcium sulfate.
Calories
Soybeans have a slightly higher calories than tofu. They contain 172 calories per 100g, while tofu has 144 calories per 100g.
Vitamins
Soybeans are a winner in the vitamin category. They contain three times more vitamin B2 and more vitamins C, E, B5, B6, K, folate, and choline.
However, tofu has 10 times higher vitamin A content than soybeans.
Vitamin Comparison
Contains
more
Vitamin CVitamin C
+750%
Contains
more
Vitamin EVitamin E
+∞%
Contains
more
Vitamin B2Vitamin B2
+179.4%
Contains
more
Vitamin B5Vitamin B5
+34.6%
Contains
more
Vitamin B6Vitamin B6
+154.3%
Contains
more
Vitamin KVitamin K
+∞%
Contains
more
FolateFolate
+86.2%
Minerals
Soybeans have more magnesium, potassium, iron, phosphorus, and sodium, while tofu contains more calcium (due to preparation steps), zinc, manganese, and selenium.
Both have a similar amount of copper.
Mineral Comparison
Contains
more
MagnesiumMagnesium
+48.3%
Contains
more
PotassiumPotassium
+117.3%
Contains
more
IronIron
+93.2%
Contains
more
PhosphorusPhosphorus
+28.9%
Contains
less
SodiumSodium
-92.9%
Contains
more
CalciumCalcium
+569.6%
Contains
more
ZincZinc
+36.5%
Contains
more
ManganeseManganese
+43.3%
Contains
more
SeleniumSelenium
+138.4%
Fats
Both foods contain similar amounts of fat; however, the types of fat are different in each. Soybeans, in particular, have more polyunsaturated fat (5g).
Protein
The amounts of protein in soybeans and tofu are almost equal: soybeans contain 18.21g, and tofu has 17.17g of protein per 100g. Both contain essential amino acids, such as lysine, histidine, and phenylalanine.
Carbs
Soybeans have almost 4 times more carbs than tofu. Due to the tofu preparation process, much of the soybean’s fiber and carbohydrate content is removed.
Soybeans have 8.36g of carbs per 100g, while tofu has only 2.78g of carbs.
Oxalates
Soybeans have 37 times more oxalates than tofu. Again, tofu has lower oxalates due to its making process, which is when many of the oxalates are removed.
Soybeans have 224mg of oxalates per 100g, while tofu offers only 6mg of oxalates. Tofu can be a good choice in low-oxalate diets.
Glycemic Index
Tofu and soybeans have similar glycemic indexes, 14 and 15, accordingly.
Health Benefits
Cancer
Isoflavones in soybeans and tofu are plant-based compounds with antioxidant properties that may help reduce cancer risk. Studies suggest that soy isoflavones modulate estrogen activity, potentially lowering the risk of hormone-dependent cancers, such as breast and prostate cancer (2).
Diabetes
Soybeans and tofu are low in carbohydrates and high in protein, which helps maintain stable blood sugar levels. Phytochemicals have been linked to improved insulin sensitivity, reducing the risk of type 2 diabetes. A meta-analysis in The American Journal of Clinical Nutrition (2019) concluded that soy protein intake positively affects glucose metabolism and insulin sensitivity (3).
Cardiovascular Health
According to FDA, 25 grams of soy protein daily as part of a low-saturated-fat diet may reduce heart disease risk. Soy protein can lower LDL (bad) cholesterol and increase HDL (good) cholesterol. Isoflavones in soy also improve arterial elasticity and reduce inflammation, key factors in cardiovascular health. A study in The Journal of Nutrition (2020) found consistent cholesterol-lowering effects with soy protein consumption (4).
References

Infographic
All nutrients comparison - raw data values
| Nutrient | |
|
DV% diff. |
| Calcium | 102mg | 683mg | 58% |
| Iron | 5.14mg | 2.66mg | 31% |
| Selenium | 7.3µg | 17.4µg | 18% |
| Manganese | 0.824mg | 1.181mg | 16% |
| Vitamin K | 19.2µg | 16% | |
| Fiber | 6g | 2.3g | 15% |
| Vitamin B2 | 0.285mg | 0.102mg | 14% |
| Vitamin B6 | 0.234mg | 0.092mg | 11% |
| Choline | 47.5mg | 9% | |
| Potassium | 515mg | 237mg | 8% |
| Phosphorus | 245mg | 190mg | 8% |
| Magnesium | 86mg | 58mg | 7% |
| Folate | 54µg | 29µg | 6% |
| Zinc | 1.15mg | 1.57mg | 4% |
| Copper | 0.407mg | 0.378mg | 3% |
| Protein | 18.21g | 17.27g | 2% |
| Vitamin C | 1.7mg | 0.2mg | 2% |
| Carbs | 8.36g | 2.78g | 2% |
| Vitamin E | 0.35mg | 2% | |
| Calories | 172kcal | 144kcal | 1% |
| Sodium | 1mg | 14mg | 1% |
| Vitamin B5 | 0.179mg | 0.133mg | 1% |
| Polyunsaturated fat | 5.064g | 4.921g | 1% |
| Protein per 100 calories | 11g | 12g | N/A |
| Calories per 10 g protein | 94kcal | 83kcal | N/A |
| Weight per 100 calories | 58g | 69g | N/A |
| Fats | 8.97g | 8.72g | 0% |
| Unsaturated / Saturated Fat ratio | 5.4 | 5.4 | N/A |
| Net carbs | 2.36g | 0.48g | N/A |
| Sugar | 3g | N/A | |
| Vitamin B1 | 0.155mg | 0.158mg | 0% |
| Vitamin B3 | 0.399mg | 0.381mg | 0% |
| Saturated fat | 1.297g | 1.261g | 0% |
| Monounsaturated fat | 1.981g | 1.925g | 0% |
| Tryptophan | 0.242mg | 0.235mg | 0% |
| Threonine | 0.723mg | 0.785mg | 0% |
| Isoleucine | 0.807mg | 0.849mg | 0% |
| Leucine | 1.355mg | 1.392mg | 0% |
| Lysine | 1.108mg | 0.883mg | 0% |
| Methionine | 0.224mg | 0.211mg | 0% |
| Phenylalanine | 0.869mg | 0.835mg | 0% |
| Valine | 0.831mg | 0.87mg | 0% |
| Histidine | 0.449mg | 0.431mg | 0% |
Macronutrient Comparison
| Contains more CarbsCarbs | +200.7% |
| Contains more OtherOther | +36.4% |
| Contains more WaterWater | +11.6% |
Fat Type Comparison
People also compare


References
All the values for which the sources are not specified explicitly are taken from FDA’s Food Central. The exact link to the food presented on this page can be found below.
- Soybean - https://fdc.nal.usda.gov/fdc-app.html#/food-details/174271/nutrients
- Tofu - https://fdc.nal.usda.gov/fdc-app.html#/food-details/172475/nutrients
All the Daily Values are presented for males aged 31-50, for 2000-calorie diets.