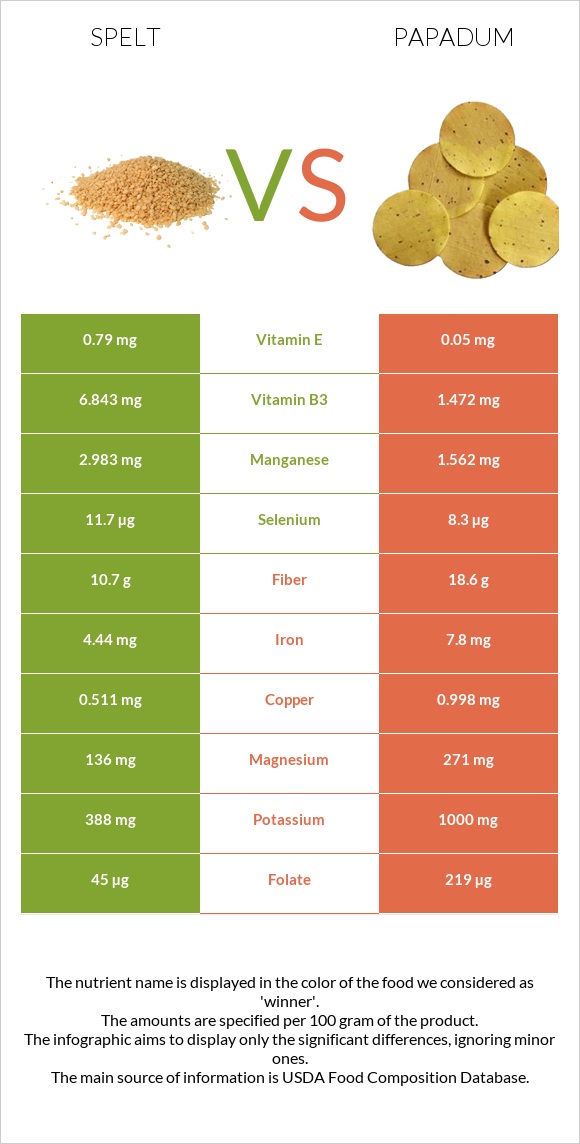
Significant differences between spelt and papadum Spelt is richer in manganese and vitamin B3, while papadum is higher in copper, folate, iron, magnesium, fiber, potassium, and calcium. Papadum covers your daily sodium needs 76% more than spelt. Spelt has 5 times more vitamin B3 than papadum. Spelt has 6.843mg of vitamin B3, while papadum has 1.472mg. Spelt is lower in sodium. Spelt has a higher glycemic index (63) than papadum (46). Specific food types used in this comparison are Spelt, uncooked and Papad .
Infographic
Mineral Comparison
Mineral comparison score is based on the number of minerals by which one or the other food is richer. The "coverage" charts below show how much of the daily needs can be covered by 300 grams of the food.
3
100 g
300 g
1 cup - 174g
Magnesium
Magnesium
Calcium
Calcium
Potassium
Potassium
Iron
Iron
Copper
Copper
Zinc
Zinc
Phosphorus
Phosphorus
Sodium
Sodium
Manganese
Manganese
Selenium
Selenium
97%
8.1%
34%
167%
170%
89%
172%
1%
389%
64%
5
100 g
300 g
Magnesium
Magnesium
Calcium
Calcium
Potassium
Potassium
Iron
Iron
Copper
Copper
Zinc
Zinc
Phosphorus
Phosphorus
Sodium
Sodium
Manganese
Manganese
Selenium
Selenium
194%
43%
88%
293%
333%
93%
165%
228%
204%
45%
Vitamin Comparison
Vitamin comparison score is based on the number of vitamins by which one or the other food is richer. The "coverage" charts below show how much of the daily needs can be covered by 300 grams of the food.
5
100 g
300 g
1 cup - 174g
Vitamin C
Vit. C
Vitamin D
Vit. D
Vitamin A
Vit. A
Vitamin E
Vit. E
Vitamin B1
Vit. B1
Vitamin B2
Vit. B2
Vitamin B3
Vit. B3
Vitamin B5
Vit. B5
Vitamin B6
Vit. B6
Vitamin B12
Vit. B12
Vitamin K
Vit. K
Folate
Folate
0%
0%
0%
16%
91%
26%
128%
64%
53%
0%
9%
34%
4
100 g
300 g
Vitamin C
Vit. C
Vitamin D
Vit. D
Vitamin A
Vit. A
Vitamin E
Vit. E
Vitamin B1
Vit. B1
Vitamin B2
Vit. B2
Vitamin B3
Vit. B3
Vitamin B5
Vit. B5
Vitamin B6
Vit. B6
Vitamin B12
Vit. B12
Vitamin K
Vit. K
Folate
Folate
0%
0%
4.3%
1%
69%
60%
28%
55%
66%
0%
1%
164%
All nutrients comparison - raw data values
Nutrient
DV% diff.
Sodium
8mg
1745mg
76%
Manganese
2.983mg
1.562mg
62%
Copper
0.511mg
0.998mg
54%
Folate
45µg
219µg
44%
Iron
4.44mg
7.8mg
42%
Vitamin B3
6.843mg
1.472mg
34%
Magnesium
136mg
271mg
32%
Fiber
10.7g
18.6g
32%
Protein
14.57g
25.56g
22%
Starch
53.92g
22%
Potassium
388mg
1000mg
18%
Calcium
27mg
143mg
12%
Vitamin B2
0.113mg
0.258mg
11%
Vitamin B1
0.364mg
0.277mg
7%
Selenium
11.7µg
8.3µg
6%
Vitamin E
0.79mg
0.05mg
5%
Vitamin B6
0.23mg
0.285mg
4%
Carbs
70.19g
59.87g
3%
Vitamin B5
1.068mg
0.917mg
3%
Vitamin K
3.6µg
0.4µg
3%
Saturated fat
0.406g
1.084g
3%
Calories
338kcal
371kcal
2%
Phosphorus
401mg
385mg
2%
Fats
2.43g
3.25g
1%
Cholesterol
0mg
4mg
1%
Zinc
3.28mg
3.4mg
1%
Vitamin A
0µg
13µg
1%
Polyunsaturated fat
1.258g
1.148g
1%
Protein per 100 calories
4.3g
6.9g
N/A
Calories per 10 g protein
232kcal
145kcal
N/A
Weight per 100 calories
30g
27g
N/A
Unsaturated / Saturated Fat ratio
4.2
1.5
N/A
Net carbs
59.49g
41.27g
N/A
Sugar
6.82g
0g
N/A
Choline
0.4mg
0%
Monounsaturated fat
0.445g
0.532g
0%
Tryptophan
0.132mg
0.266mg
0%
Threonine
0.443mg
0.886mg
0%
Isoleucine
0.552mg
1.303mg
0%
Leucine
1.07mg
2.115mg
0%
Lysine
0.409mg
1.695mg
0%
Methionine
0.258mg
0.372mg
0%
Phenylalanine
0.737mg
1.491mg
0%
Valine
0.681mg
1.434mg
0%
Histidine
0.36mg
0.715mg
0%
Fructose
0.24g
0%
Omega-3 - ALA
0.065g
N/A
Macronutrient Comparison
Macronutrient breakdown side-by-side comparison
2
15%
2%
70%
11%
2%
Protein:
14.57 g
Fats:
2.43 g
Carbs:
70.19 g
Water:
11.02 g
Other:
1.79 g
3
26%
3%
60%
3%
8%
Protein:
25.56 g
Fats:
3.25 g
Carbs:
59.87 g
Water:
3.49 g
Other:
7.83 g
Contains
more
Carbs Carbs
+17.2%
Contains
more
Water Water
+215.8%
Contains
more
Protein Protein
+75.4%
Contains
more
Fats Fats
+33.7%
Contains
more
Other Other
+337.4%
Fat Type Comparison
Fat type breakdown side-by-side comparison
2
19%
21%
60%
Saturated fat:
Sat. Fat
0.406 g
Monounsaturated fat:
Mono. Fat
0.445 g
Polyunsaturated fat:
Poly. Fat
1.258 g
1
39%
19%
42%
Saturated fat:
Sat. Fat
1.084 g
Monounsaturated fat:
Mono. Fat
0.532 g
Polyunsaturated fat:
Poly. Fat
1.148 g
Contains
less
Sat. Fat Saturated fat
-62.5%
Contains
more
Mono. Fat Monounsaturated fat
+19.6%
~equal in
Polyunsaturated fat
~1.148g