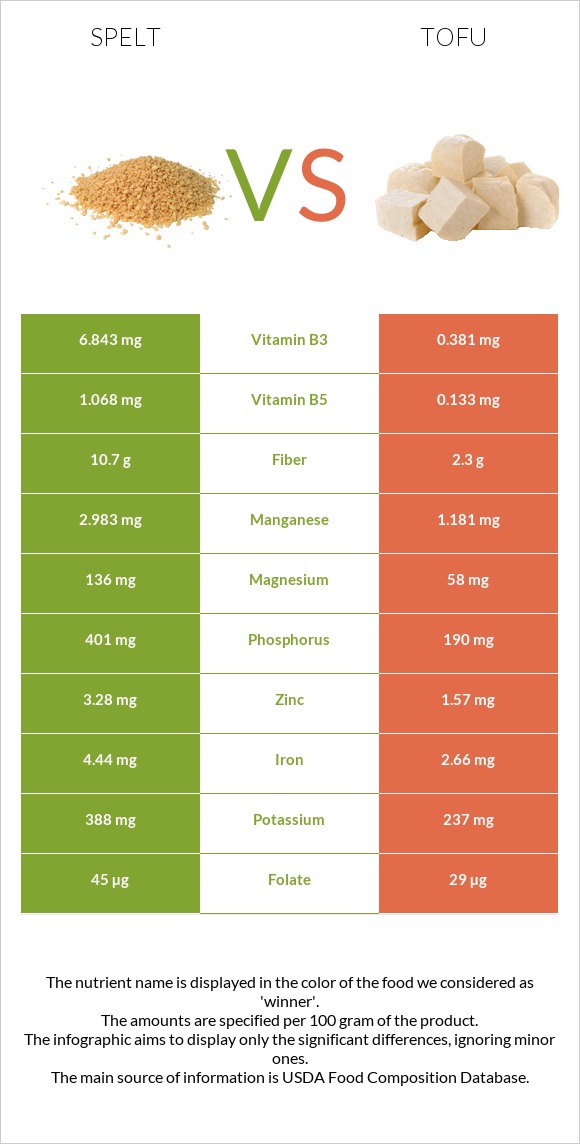
What are the main differences between spelt and tofu? Spelt is richer in manganese, vitamin B3, fiber, phosphorus, iron, vitamin B5, magnesium, vitamin B1, and zinc, yet tofu is richer in calcium. Spelt's daily need coverage for manganese is 78% higher. Spelt has 18 times more vitamin B3 than tofu. Spelt has 6.843mg of vitamin B3, while tofu has 0.381mg. Tofu has a lower glycemic index than spelt. We used Spelt, uncooked and Tofu, raw, firm, prepared with calcium sulfate types in this comparison.
Infographic
Mineral Comparison
Mineral comparison score is based on the number of minerals by which one or the other food is richer. The "coverage" charts below show how much of the daily needs can be covered by 300 grams of the food.
8
100 g
300 g
1 cup - 174g
Magnesium
Magnesium
Calcium
Calcium
Potassium
Potassium
Iron
Iron
Copper
Copper
Zinc
Zinc
Phosphorus
Phosphorus
Sodium
Sodium
Manganese
Manganese
Selenium
Selenium
97%
8.1%
34%
167%
170%
89%
172%
1%
389%
64%
2
100 g
300 g
0.25 block - 81g 0.5 cup - 126g
Magnesium
Magnesium
Calcium
Calcium
Potassium
Potassium
Iron
Iron
Copper
Copper
Zinc
Zinc
Phosphorus
Phosphorus
Sodium
Sodium
Manganese
Manganese
Selenium
Selenium
41%
205%
21%
100%
126%
43%
81%
1.8%
154%
95%
Vitamin Comparison
Vitamin comparison score is based on the number of vitamins by which one or the other food is richer. The "coverage" charts below show how much of the daily needs can be covered by 300 grams of the food.
7
100 g
300 g
1 cup - 174g
Vitamin C
Vit. C
Vitamin D
Vit. D
Vitamin A
Vit. A
Vitamin E
Vit. E
Vitamin B1
Vit. B1
Vitamin B2
Vit. B2
Vitamin B3
Vit. B3
Vitamin B5
Vit. B5
Vitamin B6
Vit. B6
Vitamin B12
Vit. B12
Vitamin K
Vit. K
Folate
Folate
0%
0%
0%
16%
91%
26%
128%
64%
53%
0%
9%
34%
1
100 g
300 g
0.25 block - 81g 0.5 cup - 126g
Vitamin C
Vit. C
Vitamin D
Vit. D
Vitamin A
Vit. A
Vitamin E
Vit. E
Vitamin B1
Vit. B1
Vitamin B2
Vit. B2
Vitamin B3
Vit. B3
Vitamin B5
Vit. B5
Vitamin B6
Vit. B6
Vitamin B12
Vit. B12
Vitamin K
Vit. K
Folate
Folate
0.67%
0%
0%
0%
40%
24%
7.1%
8%
21%
0%
0%
22%
All nutrients comparison - raw data values
Nutrient
DV% diff.
Manganese
2.983mg
1.181mg
78%
Calcium
27mg
683mg
66%
Vitamin B3
6.843mg
0.381mg
40%
Fiber
10.7g
2.3g
34%
Phosphorus
401mg
190mg
30%
Polyunsaturated fat
1.258g
4.921g
24%
Carbs
70.19g
2.78g
22%
Iron
4.44mg
2.66mg
22%
Starch
53.92g
22%
Magnesium
136mg
58mg
19%
Vitamin B5
1.068mg
0.133mg
19%
Vitamin B1
0.364mg
0.158mg
17%
Zinc
3.28mg
1.57mg
16%
Copper
0.511mg
0.378mg
15%
Vitamin B6
0.23mg
0.092mg
11%
Calories
338kcal
144kcal
10%
Fats
2.43g
8.72g
10%
Selenium
11.7µg
17.4µg
10%
Protein
14.57g
17.27g
5%
Vitamin E
0.79mg
5%
Potassium
388mg
237mg
4%
Folate
45µg
29µg
4%
Saturated fat
0.406g
1.261g
4%
Monounsaturated fat
0.445g
1.925g
4%
Vitamin K
3.6µg
3%
Vitamin B2
0.113mg
0.102mg
1%
Protein per 100 calories
4.3g
12g
N/A
Calories per 10 g protein
232kcal
83kcal
N/A
Weight per 100 calories
30g
69g
N/A
Unsaturated / Saturated Fat ratio
4.2
5.4
N/A
Vitamin C
0mg
0.2mg
0%
Net carbs
59.49g
0.48g
N/A
Sugar
6.82g
N/A
Sodium
8mg
14mg
0%
Tryptophan
0.132mg
0.235mg
0%
Threonine
0.443mg
0.785mg
0%
Isoleucine
0.552mg
0.849mg
0%
Leucine
1.07mg
1.392mg
0%
Lysine
0.409mg
0.883mg
0%
Methionine
0.258mg
0.211mg
0%
Phenylalanine
0.737mg
0.835mg
0%
Valine
0.681mg
0.87mg
0%
Histidine
0.36mg
0.431mg
0%
Fructose
0.24g
0%
Omega-3 - ALA
0.065g
N/A
Macronutrient Comparison
Macronutrient breakdown side-by-side comparison
2
15%
2%
70%
11%
2%
Protein:
14.57 g
Fats:
2.43 g
Carbs:
70.19 g
Water:
11.02 g
Other:
1.79 g
3
17%
9%
3%
70%
Protein:
17.27 g
Fats:
8.72 g
Carbs:
2.78 g
Water:
69.83 g
Other:
1.4 g
Contains
more
Carbs Carbs
+2424.8%
Contains
more
Other Other
+27.9%
Contains
more
Protein Protein
+18.5%
Contains
more
Fats Fats
+258.8%
Contains
more
Water Water
+533.7%
Fat Type Comparison
Fat type breakdown side-by-side comparison
1
19%
21%
60%
Saturated fat:
Sat. Fat
0.406 g
Monounsaturated fat:
Mono. Fat
0.445 g
Polyunsaturated fat:
Poly. Fat
1.258 g
2
16%
24%
61%
Saturated fat:
Sat. Fat
1.261 g
Monounsaturated fat:
Mono. Fat
1.925 g
Polyunsaturated fat:
Poly. Fat
4.921 g
Contains
less
Sat. Fat Saturated fat
-67.8%
Contains
more
Mono. Fat Monounsaturated fat
+332.6%
Contains
more
Poly. Fat Polyunsaturated fat
+291.2%