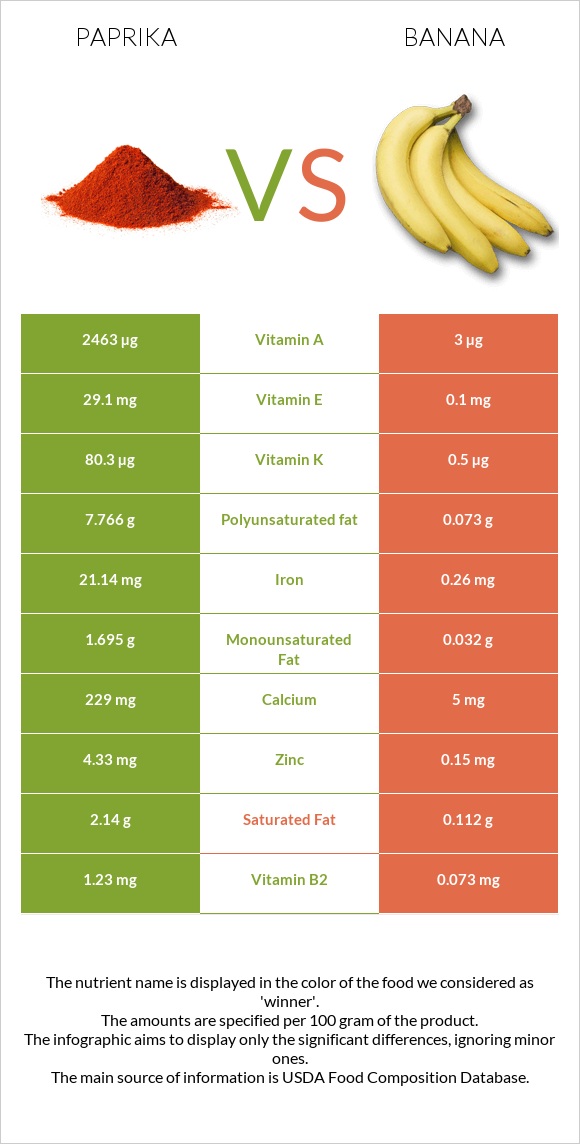
How are paprika and bananas different? Paprika is higher than bananas in vitamin A, iron, vitamin E, vitamin B6, fiber, vitamin B2, copper, vitamin K, vitamin B3, and manganese. Paprika covers your daily need for vitamin A, 984% more than bananas. Paprika contains 291 times more vitamin E than bananas. Paprika contains 29.1mg of vitamin E, while bananas contain 0.1mg. Bananas have a higher glycemic index (48) than paprika (0). Spices, paprika and Bananas, raw types were used in this article.
Infographic
Mineral Comparison
Mineral comparison score is based on the number of minerals by which one or the other food is richer. The "coverage" charts below show how much of the daily needs can be covered by 300 grams of the food.
9
100 g
300 g
0.25 tsp - 0.5g 1 tbsp - 6.8g
Magnesium
Magnesium
Calcium
Calcium
Potassium
Potassium
Iron
Iron
Copper
Copper
Zinc
Zinc
Phosphorus
Phosphorus
Sodium
Sodium
Manganese
Manganese
Selenium
Selenium
127%
69%
201%
793%
238%
118%
135%
8.9%
207%
34%
1
100 g
300 g
1 extra small (less than 6" long) - 81g 1 small (6" to 6-7/8" long) - 101g 1 medium (7" to 7-7/8" long) - 118g 1 NLEA serving - 126g 1 large (8" to 8-7/8" long) - 136g 1 cup, sliced - 150g 1 extra large (9" or longer) - 152g 1 cup, mashed - 225g
Magnesium
Magnesium
Calcium
Calcium
Potassium
Potassium
Iron
Iron
Copper
Copper
Zinc
Zinc
Phosphorus
Phosphorus
Sodium
Sodium
Manganese
Manganese
Selenium
Selenium
19%
1.5%
32%
9.8%
26%
4.1%
9.4%
0.13%
35%
5.5%
Vitamin Comparison
Vitamin comparison score is based on the number of vitamins by which one or the other food is richer. The "coverage" charts below show how much of the daily needs can be covered by 300 grams of the food.
9
100 g
300 g
0.25 tsp - 0.5g 1 tbsp - 6.8g
Vitamin C
Vit. C
Vitamin D
Vit. D
Vitamin A
Vit. A
Vitamin E
Vit. E
Vitamin B1
Vit. B1
Vitamin B2
Vit. B2
Vitamin B3
Vit. B3
Vitamin B5
Vit. B5
Vitamin B6
Vit. B6
Vitamin B12
Vit. B12
Vitamin K
Vit. K
Folate
Folate
3%
0%
821%
582%
83%
284%
189%
151%
494%
0%
201%
37%
1
100 g
300 g
1 extra small (less than 6" long) - 81g 1 small (6" to 6-7/8" long) - 101g 1 medium (7" to 7-7/8" long) - 118g 1 NLEA serving - 126g 1 large (8" to 8-7/8" long) - 136g 1 cup, sliced - 150g 1 extra large (9" or longer) - 152g 1 cup, mashed - 225g
Vitamin C
Vit. C
Vitamin D
Vit. D
Vitamin A
Vit. A
Vitamin E
Vit. E
Vitamin B1
Vit. B1
Vitamin B2
Vit. B2
Vitamin B3
Vit. B3
Vitamin B5
Vit. B5
Vitamin B6
Vit. B6
Vitamin B12
Vit. B12
Vitamin K
Vit. K
Folate
Folate
29%
0%
1%
2%
7.8%
17%
12%
20%
85%
0%
1.3%
15%
All nutrients comparison - raw data values
Nutrient
DV% diff.
Vitamin A
2463µg
3µg
273%
Iron
21.14mg
0.26mg
261%
Vitamin E
29.1mg
0.1mg
193%
Vitamin B6
2.141mg
0.367mg
136%
Fiber
34.9g
2.6g
129%
Vitamin B2
1.23mg
0.073mg
89%
Copper
0.713mg
0.078mg
71%
Vitamin K
80.3µg
0.5µg
67%
Vitamin B3
10.06mg
0.665mg
59%
Potassium
2280mg
358mg
57%
Manganese
1.59mg
0.27mg
57%
Polyunsaturated fat
7.766g
0.073g
51%
Vitamin B5
2.51mg
0.334mg
44%
Phosphorus
314mg
22mg
42%
Zinc
4.33mg
0.15mg
38%
Magnesium
178mg
27mg
36%
Protein
14.14g
1.09g
26%
Vitamin B1
0.33mg
0.031mg
25%
Calcium
229mg
5mg
22%
Fats
12.89g
0.33g
19%
Calories
282kcal
89kcal
10%
Carbs
53.99g
22.84g
10%
Selenium
6.3µg
1µg
10%
Vitamin C
0.9mg
8.7mg
9%
Saturated fat
2.14g
0.112g
9%
Choline
51.5mg
9.8mg
8%
Folate
49µg
20µg
7%
Monounsaturated fat
1.695g
0.032g
4%
Sodium
68mg
1mg
3%
Starch
5.38g
2%
Fructose
6.71g
4.85g
2%
Protein per 100 calories
5g
1.2g
N/A
Calories per 10 g protein
199kcal
817kcal
N/A
Weight per 100 calories
35g
112g
N/A
Unsaturated / Saturated Fat ratio
4.4
0.94
N/A
Net carbs
19.09g
20.24g
N/A
Sugar
10.34g
12.23g
N/A
Tryptophan
0.07mg
0.009mg
0%
Threonine
0.49mg
0.028mg
0%
Isoleucine
0.57mg
0.028mg
0%
Leucine
0.92mg
0.068mg
0%
Lysine
0.69mg
0.05mg
0%
Methionine
0.2mg
0.008mg
0%
Phenylalanine
0.61mg
0.049mg
0%
Valine
0.75mg
0.047mg
0%
Histidine
0.25mg
0.077mg
0%
Omega-3 - ALA
0.453g
N/A
Macronutrient Comparison
Macronutrient breakdown side-by-side comparison
4
14%
13%
54%
11%
8%
Protein:
14.14 g
Fats:
12.89 g
Carbs:
53.99 g
Water:
11.24 g
Other:
7.74 g
1
23%
75%
Protein:
1.09 g
Fats:
0.33 g
Carbs:
22.84 g
Water:
74.91 g
Other:
0.83 g
Contains
more
Protein Protein
+1197.2%
Contains
more
Fats Fats
+3806.1%
Contains
more
Carbs Carbs
+136.4%
Contains
more
Other Other
+832.5%
Contains
more
Water Water
+566.5%
Fat Type Comparison
Fat type breakdown side-by-side comparison
2
18%
15%
67%
Saturated fat:
Sat. Fat
2.14 g
Monounsaturated fat:
Mono. Fat
1.695 g
Polyunsaturated fat:
Poly. Fat
7.766 g
1
52%
15%
34%
Saturated fat:
Sat. Fat
0.112 g
Monounsaturated fat:
Mono. Fat
0.032 g
Polyunsaturated fat:
Poly. Fat
0.073 g
Contains
more
Mono. Fat Monounsaturated fat
+5196.9%
Contains
more
Poly. Fat Polyunsaturated fat
+10538.4%
Contains
less
Sat. Fat Saturated fat
-94.8%
Carbohydrate type comparison
Carbohydrate type breakdown side-by-side comparison
2
8%
25%
65%
2%
Starch:
0 g
Sucrose:
0.81 g
Glucose:
2.63 g
Fructose:
6.71 g
Lactose:
0 g
Maltose:
0 g
Galactose:
0.19 g
4
31%
14%
28%
28%
Starch:
5.38 g
Sucrose:
2.39 g
Glucose:
4.98 g
Fructose:
4.85 g
Lactose:
0 g
Maltose:
0.01 g
Galactose:
0 g
Contains
more
Fructose Fructose
+38.4%
Contains
more
Galactose Galactose
+∞%
Contains
more
Starch Starch
+∞%
Contains
more
Sucrose Sucrose
+195.1%
Contains
more
Glucose Glucose
+89.4%
Contains
more
Maltose Maltose
+∞%