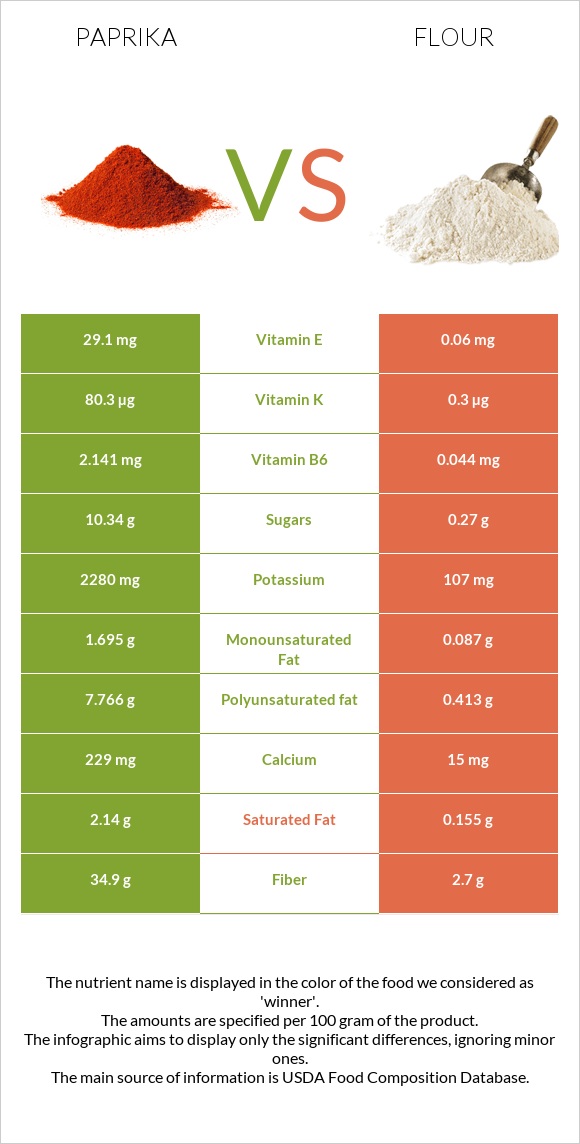
How are paprika and flour different? Paprika is higher in vitamin A, iron, vitamin E, vitamin B6, fiber, vitamin K, potassium, copper, and vitamin B2; however, flour is richer in selenium. Daily need coverage for vitamin A for paprika is 985% higher. Paprika contains 485 times more vitamin E than flour. While paprika contains 29.1mg of vitamin E, flour contains only 0.06mg. Paprika has a lower glycemic index (0) than flour (72). Spices, paprika and Wheat flour, white, all-purpose, enriched, bleached are the varieties used in this article.
Infographic
Mineral Comparison
Mineral comparison score is based on the number of minerals by which one or the other food is richer. The "coverage" charts below show how much of the daily needs can be covered by 300 grams of the food.
8
100 g
300 g
0.25 tsp - 0.5g 1 tbsp - 6.8g
Magnesium
Magnesium
Calcium
Calcium
Potassium
Potassium
Iron
Iron
Copper
Copper
Zinc
Zinc
Phosphorus
Phosphorus
Sodium
Sodium
Manganese
Manganese
Selenium
Selenium
127%
69%
201%
793%
238%
118%
135%
8.9%
207%
34%
2
100 g
300 g
1 cup - 125g
Magnesium
Magnesium
Calcium
Calcium
Potassium
Potassium
Iron
Iron
Copper
Copper
Zinc
Zinc
Phosphorus
Phosphorus
Sodium
Sodium
Manganese
Manganese
Selenium
Selenium
16%
4.5%
9.4%
174%
48%
19%
46%
0.26%
89%
185%
Vitamin Comparison
Vitamin comparison score is based on the number of vitamins by which one or the other food is richer. The "coverage" charts below show how much of the daily needs can be covered by 300 grams of the food.
8
100 g
300 g
0.25 tsp - 0.5g 1 tbsp - 6.8g
Vitamin C
Vit. C
Vitamin D
Vit. D
Vitamin A
Vit. A
Vitamin E
Vit. E
Vitamin B1
Vit. B1
Vitamin B2
Vit. B2
Vitamin B3
Vit. B3
Vitamin B5
Vit. B5
Vitamin B6
Vit. B6
Vitamin B12
Vit. B12
Vitamin K
Vit. K
Folate
Folate
3%
0%
821%
582%
83%
284%
189%
151%
494%
0%
201%
37%
2
100 g
300 g
1 cup - 125g
Vitamin C
Vit. C
Vitamin D
Vit. D
Vitamin A
Vit. A
Vitamin E
Vit. E
Vitamin B1
Vit. B1
Vitamin B2
Vit. B2
Vitamin B3
Vit. B3
Vitamin B5
Vit. B5
Vitamin B6
Vit. B6
Vitamin B12
Vit. B12
Vitamin K
Vit. K
Folate
Folate
0%
0%
0%
1.2%
196%
114%
111%
26%
10%
0%
0.75%
137%
All nutrients comparison - raw data values
Nutrient
DV% diff.
Vitamin A
2463µg
0µg
274%
Iron
21.14mg
4.64mg
206%
Vitamin E
29.1mg
0.06mg
194%
Vitamin B6
2.141mg
0.044mg
161%
Fiber
34.9g
2.7g
129%
Vitamin K
80.3µg
0.3µg
67%
Potassium
2280mg
107mg
64%
Copper
0.713mg
0.144mg
63%
Vitamin B2
1.23mg
0.494mg
57%
Selenium
6.3µg
33.9µg
50%
Polyunsaturated fat
7.766g
0.413g
49%
Vitamin B5
2.51mg
0.438mg
41%
Manganese
1.59mg
0.682mg
39%
Vitamin B1
0.33mg
0.785mg
38%
Magnesium
178mg
22mg
37%
Folate
49µg
183µg
34%
Zinc
4.33mg
0.7mg
33%
Phosphorus
314mg
108mg
29%
Vitamin B3
10.06mg
5.904mg
26%
Calcium
229mg
15mg
21%
Fats
12.89g
0.98g
18%
Saturated fat
2.14g
0.155g
9%
Protein
14.14g
10.33g
8%
Fructose
6.71g
8%
Carbs
53.99g
76.31g
7%
Choline
51.5mg
10.4mg
7%
Calories
282kcal
364kcal
4%
Monounsaturated fat
1.695g
0.087g
4%
Sodium
68mg
2mg
3%
Vitamin C
0.9mg
0mg
1%
Protein per 100 calories
5g
2.8g
N/A
Calories per 10 g protein
199kcal
352kcal
N/A
Weight per 100 calories
35g
27g
N/A
Unsaturated / Saturated Fat ratio
4.4
3.2
N/A
Net carbs
19.09g
73.61g
N/A
Sugar
10.34g
0.27g
N/A
Tryptophan
0.07mg
0.127mg
0%
Threonine
0.49mg
0.281mg
0%
Isoleucine
0.57mg
0.357mg
0%
Leucine
0.92mg
0.71mg
0%
Lysine
0.69mg
0.228mg
0%
Methionine
0.2mg
0.183mg
0%
Phenylalanine
0.61mg
0.52mg
0%
Valine
0.75mg
0.415mg
0%
Histidine
0.25mg
0.23mg
0%
Omega-3 - ALA
0.453g
N/A
Macronutrient Comparison
Macronutrient breakdown side-by-side comparison
3
14%
13%
54%
11%
8%
Protein:
14.14 g
Fats:
12.89 g
Carbs:
53.99 g
Water:
11.24 g
Other:
7.74 g
2
10%
76%
12%
Protein:
10.33 g
Fats:
0.98 g
Carbs:
76.31 g
Water:
11.92 g
Other:
0.46 g
Contains
more
Protein Protein
+36.9%
Contains
more
Fats Fats
+1215.3%
Contains
more
Other Other
+1582.6%
Contains
more
Carbs Carbs
+41.3%
Fat Type Comparison
Fat type breakdown side-by-side comparison
2
18%
15%
67%
Saturated fat:
Sat. Fat
2.14 g
Monounsaturated fat:
Mono. Fat
1.695 g
Polyunsaturated fat:
Poly. Fat
7.766 g
1
24%
13%
63%
Saturated fat:
Sat. Fat
0.155 g
Monounsaturated fat:
Mono. Fat
0.087 g
Polyunsaturated fat:
Poly. Fat
0.413 g
Contains
more
Mono. Fat Monounsaturated fat
+1848.3%
Contains
more
Poly. Fat Polyunsaturated fat
+1780.4%
Contains
less
Sat. Fat Saturated fat
-92.8%