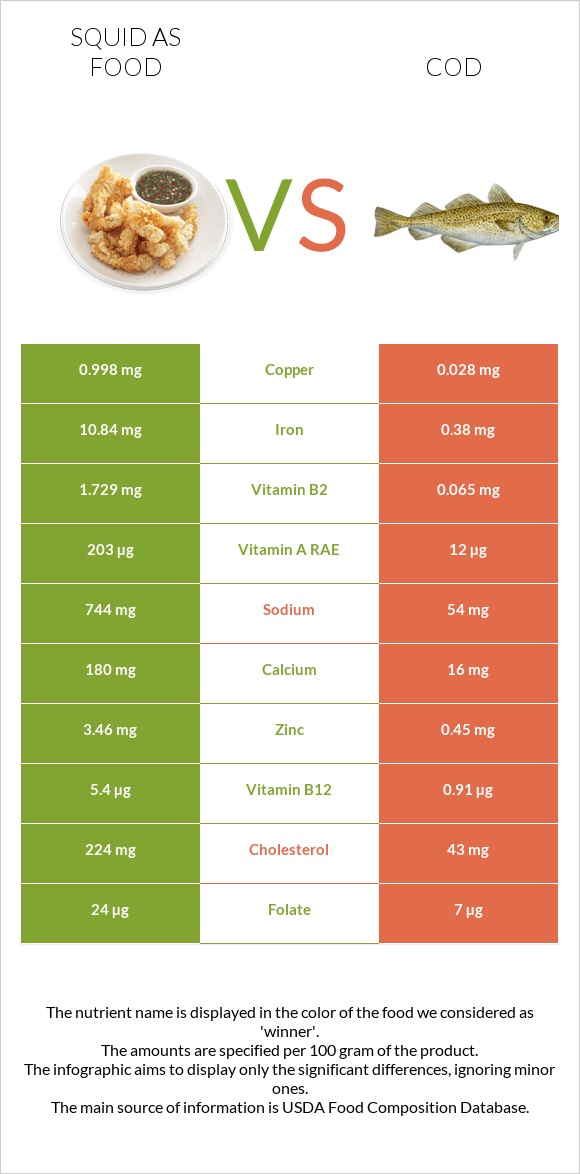
The main differences between squid and cod Squid is richer in vitamin B12, iron, vitamin B2, copper, selenium, phosphorus, and zinc, yet cod is richer in vitamin B5. Daily need coverage for vitamin B5 for cod is 3042% higher. Squid contains 36 times more copper than cod. Squid contains 0.998mg of copper, while cod contains 0.028mg. Cod contains less sodium. Food types used in this article are Mollusks, cuttlefish, mixed species, cooked, moist heat and Fish, cod, Atlantic, raw .
Infographic
Mineral Comparison
Mineral comparison score is based on the number of minerals by which one or the other food is richer. The "coverage" charts below show how much of the daily needs can be covered by 300 grams of the food.
9
100 g
300 g
3 oz - 85g
Magnesium
Magnesium
Calcium
Calcium
Potassium
Potassium
Iron
Iron
Copper
Copper
Zinc
Zinc
Phosphorus
Phosphorus
Sodium
Sodium
Manganese
Manganese
Selenium
Selenium
43%
54%
56%
407%
333%
94%
249%
97%
27%
489%
1
100 g
300 g
3 oz - 85g 1 fillet - 231g
Magnesium
Magnesium
Calcium
Calcium
Potassium
Potassium
Iron
Iron
Copper
Copper
Zinc
Zinc
Phosphorus
Phosphorus
Sodium
Sodium
Manganese
Manganese
Selenium
Selenium
23%
4.8%
36%
14%
9.3%
12%
87%
7%
2%
181%
Vitamin Comparison
Vitamin comparison score is based on the number of vitamins by which one or the other food is richer. The "coverage" charts below show how much of the daily needs can be covered by 300 grams of the food.
5
100 g
300 g
3 oz - 85g
Vitamin C
Vit. C
Vitamin D
Vit. D
Vitamin A
Vit. A
Vitamin E
Vit. E
Vitamin B1
Vit. B1
Vitamin B2
Vit. B2
Vitamin B3
Vit. B3
Vitamin B5
Vit. B5
Vitamin B6
Vit. B6
Vitamin B12
Vit. B12
Vitamin K
Vit. K
Folate
Folate
28%
0%
68%
0%
4.3%
399%
41%
54%
62%
675%
0%
18%
5
100 g
300 g
3 oz - 85g 1 fillet - 231g
Vitamin C
Vit. C
Vitamin D
Vit. D
Vitamin A
Vit. A
Vitamin E
Vit. E
Vitamin B1
Vit. B1
Vitamin B2
Vit. B2
Vitamin B3
Vit. B3
Vitamin B5
Vit. B5
Vitamin B6
Vit. B6
Vitamin B12
Vit. B12
Vitamin K
Vit. K
Folate
Folate
3.3%
14%
4%
13%
19%
15%
39%
9180%
57%
114%
0.25%
5.3%
All nutrients comparison - raw data values
Nutrient
DV% diff.
Vitamin B5
0.9mg
153mg
3042%
Vitamin B12
5.4µg
0.91µg
187%
Iron
10.84mg
0.38mg
131%
Vitamin B2
1.729mg
0.065mg
128%
Copper
0.998mg
0.028mg
108%
Selenium
89.6µg
33.1µg
103%
Cholesterol
224mg
43mg
60%
Phosphorus
580mg
203mg
54%
Sodium
744mg
54mg
30%
Protein
32.48g
17.81g
29%
Zinc
3.46mg
0.45mg
27%
Vitamin A
203µg
12µg
21%
Calcium
180mg
16mg
16%
Choline
65.2mg
12%
Vitamin C
8.5mg
1mg
8%
Manganese
0.209mg
0.015mg
8%
Magnesium
60mg
32mg
7%
Potassium
637mg
413mg
7%
Vitamin D*
36 IU
5%
Vitamin D
0.9µg
5%
Vitamin B1
0.017mg
0.076mg
5%
Calories
158kcal
82kcal
4%
Vitamin E
0.64mg
4%
Folate
24µg
7µg
4%
Vitamin B6
0.27mg
0.245mg
2%
Fats
1.4g
0.67g
1%
Carbs
1.64g
0g
1%
Vitamin B3
2.189mg
2.063mg
1%
Protein per 100 calories
21g
22g
N/A
Calories per 10 g protein
49kcal
46kcal
N/A
Weight per 100 calories
63g
122g
N/A
Net carbs
1.64g
0g
N/A
Vitamin K
0.1µg
0%
Saturated fat
0.236g
0.131g
0%
Monounsaturated fat
0.162g
0.094g
0%
Polyunsaturated fat
0.268g
0.231g
0%
Tryptophan
0.364mg
0.199mg
0%
Threonine
1.398mg
0.781mg
0%
Isoleucine
1.414mg
0.821mg
0%
Leucine
2.287mg
1.447mg
0%
Lysine
2.427mg
1.635mg
0%
Methionine
0.733mg
0.527mg
0%
Phenylalanine
1.164mg
0.695mg
0%
Valine
1.419mg
0.917mg
0%
Histidine
0.624mg
0.524mg
0%
Omega-3 - EPA
0.078g
0.064g
N/A
Omega-3 - DHA
0.132g
0.12g
N/A
Omega-3 - DPA
0.012g
0.01g
N/A
Macronutrient Comparison
Macronutrient breakdown side-by-side comparison
4
32%
61%
3%
Protein:
32.48 g
Fats:
1.4 g
Carbs:
1.64 g
Water:
61.12 g
Other:
3.36 g
1
18%
81%
Protein:
17.81 g
Fats:
0.67 g
Carbs:
0 g
Water:
81.22 g
Other:
0.3 g
Contains
more
Protein Protein
+82.4%
Contains
more
Fats Fats
+109%
Contains
more
Carbs Carbs
+∞%
Contains
more
Other Other
+1020%
Contains
more
Water Water
+32.9%
Fat Type Comparison
Fat type breakdown side-by-side comparison
2
35%
24%
40%
Saturated fat:
Sat. Fat
0.236 g
Monounsaturated fat:
Mono. Fat
0.162 g
Polyunsaturated fat:
Poly. Fat
0.268 g
1
29%
21%
51%
Saturated fat:
Sat. Fat
0.131 g
Monounsaturated fat:
Mono. Fat
0.094 g
Polyunsaturated fat:
Poly. Fat
0.231 g
Contains
more
Mono. Fat Monounsaturated fat
+72.3%
Contains
more
Poly. Fat Polyunsaturated fat
+16%
Contains
less
Sat. Fat Saturated fat
-44.5%