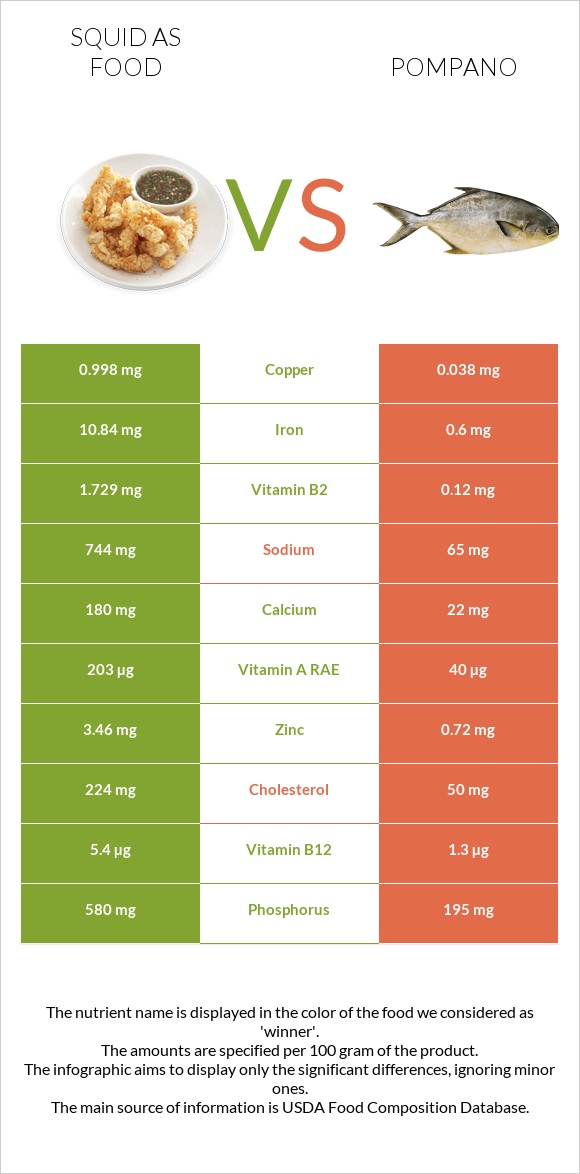
How are squid and pompano different? Squid has more vitamin B12, iron, vitamin B2, copper, selenium, phosphorus, and zinc; however, pompano is richer in vitamin B1. Squid covers your daily need for vitamin B12, 175% more than pompano. Squid has 16 times more iron than pompano. Squid has 10.84mg of iron, while pompano has 0.67mg. Pompano contains less sodium. Mollusks, cuttlefish, mixed species, cooked, moist heat and Fish, pompano, florida, cooked, dry heat types were used in this article.
Infographic
Mineral Comparison
Mineral comparison score is based on the number of minerals by which one or the other food is richer. The "coverage" charts below show how much of the daily needs can be covered by 300 grams of the food.
8
100 g
300 g
3 oz - 85g
Magnesium
Magnesium
Calcium
Calcium
Potassium
Potassium
Iron
Iron
Copper
Copper
Zinc
Zinc
Phosphorus
Phosphorus
Sodium
Sodium
Manganese
Manganese
Selenium
Selenium
43%
54%
56%
407%
333%
94%
249%
97%
27%
489%
1
100 g
300 g
3 oz - 85g 1 fillet - 88g
Magnesium
Magnesium
Calcium
Calcium
Potassium
Potassium
Iron
Iron
Copper
Copper
Zinc
Zinc
Phosphorus
Phosphorus
Sodium
Sodium
Manganese
Manganese
Selenium
Selenium
22%
13%
56%
25%
26%
19%
146%
9.9%
3.3%
255%
Vitamin Comparison
Vitamin comparison score is based on the number of vitamins by which one or the other food is richer. The "coverage" charts below show how much of the daily needs can be covered by 300 grams of the food.
6
100 g
300 g
3 oz - 85g
Vitamin C
Vit. C
Vitamin D
Vit. D
Vitamin A
Vit. A
Vitamin E
Vit. E
Vitamin B1
Vit. B1
Vitamin B2
Vit. B2
Vitamin B3
Vit. B3
Vitamin B5
Vit. B5
Vitamin B6
Vit. B6
Vitamin B12
Vit. B12
Vitamin K
Vit. K
Folate
Folate
28%
0%
68%
0%
4.3%
399%
41%
54%
62%
675%
0%
18%
2
100 g
300 g
3 oz - 85g 1 fillet - 88g
Vitamin C
Vit. C
Vitamin D
Vit. D
Vitamin A
Vit. A
Vitamin E
Vit. E
Vitamin B1
Vit. B1
Vitamin B2
Vit. B2
Vitamin B3
Vit. B3
Vitamin B5
Vit. B5
Vitamin B6
Vit. B6
Vitamin B12
Vit. B12
Vitamin K
Vit. K
Folate
Folate
0%
0%
12%
0%
170%
35%
71%
52%
53%
150%
0%
13%
All nutrients comparison - raw data values
Nutrient
DV% diff.
Vitamin B12
5.4µg
1.2µg
175%
Iron
10.84mg
0.67mg
127%
Vitamin B2
1.729mg
0.15mg
121%
Copper
0.998mg
0.078mg
102%
Selenium
89.6µg
46.8µg
78%
Vitamin B1
0.017mg
0.68mg
55%
Cholesterol
224mg
64mg
53%
Phosphorus
580mg
341mg
34%
Sodium
744mg
76mg
29%
Zinc
3.46mg
0.69mg
25%
Vitamin A
203µg
36µg
19%
Saturated fat
0.236g
4.499g
19%
Protein
32.48g
23.69g
18%
Fats
1.4g
12.14g
17%
Calcium
180mg
43mg
14%
Vitamin B3
2.189mg
3.8mg
10%
Vitamin C
8.5mg
0mg
9%
Manganese
0.209mg
0.025mg
8%
Monounsaturated fat
0.162g
3.315g
8%
Polyunsaturated fat
0.268g
1.458g
8%
Magnesium
60mg
31mg
7%
Calories
158kcal
211kcal
3%
Vitamin B6
0.27mg
0.23mg
3%
Folate
24µg
17µg
2%
Carbs
1.64g
0g
1%
Vitamin B5
0.9mg
0.87mg
1%
Protein per 100 calories
21g
11g
N/A
Calories per 10 g protein
49kcal
89kcal
N/A
Weight per 100 calories
63g
47g
N/A
Unsaturated / Saturated Fat ratio
1.8
1.1
N/A
Net carbs
1.64g
0g
N/A
Potassium
637mg
636mg
0%
Tryptophan
0.364mg
0.265mg
0%
Threonine
1.398mg
1.038mg
0%
Isoleucine
1.414mg
1.092mg
0%
Leucine
2.287mg
1.925mg
0%
Lysine
2.427mg
2.175mg
0%
Methionine
0.733mg
0.701mg
0%
Phenylalanine
1.164mg
0.925mg
0%
Valine
1.419mg
1.22mg
0%
Histidine
0.624mg
0.697mg
0%
Omega-3 - EPA
0.078g
0.224g
N/A
Omega-3 - DHA
0.132g
0.504g
N/A
Omega-3 - DPA
0.012g
0.259g
N/A
Macronutrient Comparison
Macronutrient breakdown side-by-side comparison
3
32%
61%
3%
Protein:
32.48 g
Fats:
1.4 g
Carbs:
1.64 g
Water:
61.12 g
Other:
3.36 g
2
24%
12%
63%
Protein:
23.69 g
Fats:
12.14 g
Carbs:
0 g
Water:
62.97 g
Other:
1.2 g
Contains
more
Protein Protein
+37.1%
Contains
more
Carbs Carbs
+∞%
Contains
more
Other Other
+180%
Contains
more
Fats Fats
+767.1%
Fat Type Comparison
Fat type breakdown side-by-side comparison
1
35%
24%
40%
Saturated fat:
Sat. Fat
0.236 g
Monounsaturated fat:
Mono. Fat
0.162 g
Polyunsaturated fat:
Poly. Fat
0.268 g
2
49%
36%
16%
Saturated fat:
Sat. Fat
4.499 g
Monounsaturated fat:
Mono. Fat
3.315 g
Polyunsaturated fat:
Poly. Fat
1.458 g
Contains
less
Sat. Fat Saturated fat
-94.8%
Contains
more
Mono. Fat Monounsaturated fat
+1946.3%
Contains
more
Poly. Fat Polyunsaturated fat
+444%