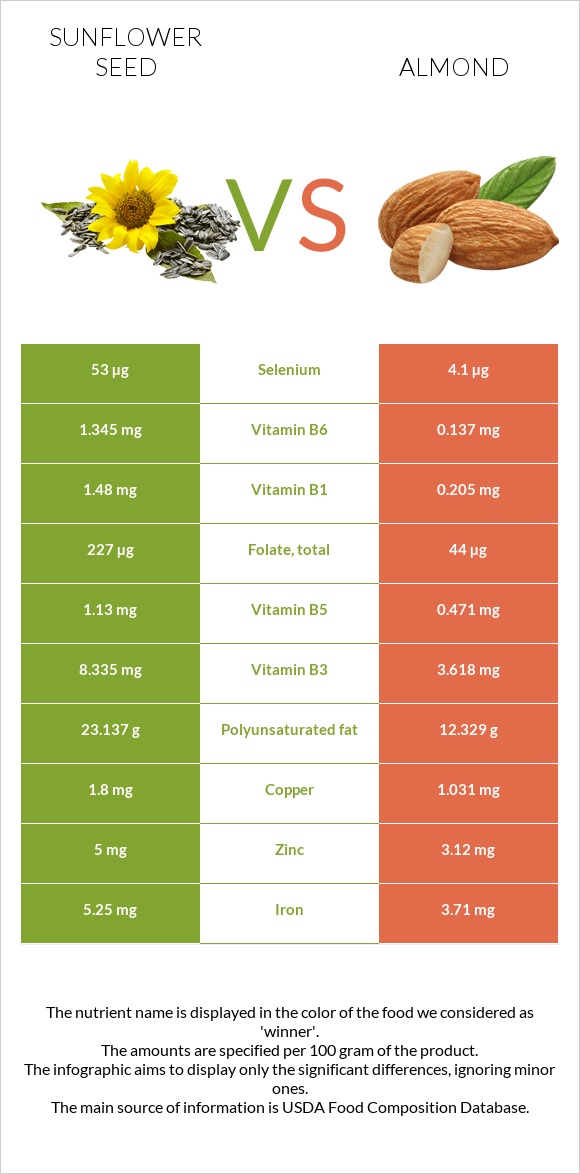
Sunflower seeds vs Almonds - In-Depth Nutrition Comparison


Summary
Almond is higher in Vitamin B2, calcium, and potassium; it has less sodium, saturated fats, and lower GI. Sunflower seeds are higher in minerals and vitamins and have lower sugars than almonds.
Introduction
We will mainly go through the differences between almonds and sunflower seeds, focusing on nutrition and health impact.
Varieties
The sunflower seed is the seed of Helianthus annuus. Sunflower seeds are classified into linoleic, high oleic, and sunflower oil seeds. Linoleic seeds are the most common type.
The Prunus genus includes almonds, also known as Prunus dulcis. They are not true nuts but rather stone fruits known as drupes. The most common almond types are sweet almonds and bitter almonds. Both are used in the kitchen. This depends on amygdalin content.
Taste and Uses
Almonds have a mild earthy flavor, while their skin might taste bitter. Almonds can be used as snacks or as ingredients in various dishes, desserts, etc.
Although they are not classified as nuts, sunflower seeds have a nutty flavor and a tender texture. They can be used in salad and cooking and can be eaten raw.
Nutrition
Both almonds and sunflower seeds have rich nutrition content. You can find the visual infographics and tables at the bottom of this page.
Calories
Sunflower seeds and almonds have almost an equal number of calories. Almond contains 579 calories per 100g, while sunflower seeds contain 584 calories per 100g. Both are classified as high-calorie foods.
Vitamins
Sunflower seeds are richer in vitamins. They contain 24 times more Vitamin A, eight times more Vitamin B6, more Vitamin B2, Vitamin B3, Vitamin B5, Vitamin B1, Vitamin C, and Folate.
Sunflower seeds fall in the range of the top 9% of foods as a source of Vitamin B1. They can cover your daily recommended Vitamin B1 dose.
The amount of Vitamin B2 is higher in almonds.
Both almonds and sunflower seeds have no Vitamin D, Vitamin K, and Vitamin B12.
Vitamin Comparison
Contains
more
Vitamin CVitamin C
+∞%
Contains
more
Vitamin AVitamin A
+∞%
Contains
more
Vitamin EVitamin E
+37.2%
Contains
more
Vitamin B1Vitamin B1
+622%
Contains
more
Vitamin B3Vitamin B3
+130.4%
Contains
more
Vitamin B5Vitamin B5
+139.9%
Contains
more
Vitamin B6Vitamin B6
+881.8%
Contains
more
FolateFolate
+415.9%
Contains
more
Vitamin B2Vitamin B2
+220.6%
Minerals
Both sunflower seeds and almonds have rich mineral profiles.
Sunflower seeds have more iron, magnesium, phosphorus, zinc, and copper.
Sunflower seeds fall in the range of the top 8% of foods as a source of magnesium and phosphorus.
On the other hand, almonds have more calcium and potassium and less sodium. Almonds fall in the range of the top 8% of foods as a source of potassium.
Mineral Comparison
Contains
more
MagnesiumMagnesium
+20.4%
Contains
more
IronIron
+41.5%
Contains
more
CopperCopper
+74.6%
Contains
more
ZincZinc
+60.3%
Contains
more
PhosphorusPhosphorus
+37.2%
Contains
more
SeleniumSelenium
+1192.7%
Contains
more
CalciumCalcium
+244.9%
Contains
more
PotassiumPotassium
+13.6%
Contains
less
SodiumSodium
-88.9%
Contains
more
ManganeseManganese
+11.7%
Glycemic Index
The carbohydrate content of almonds is relatively high; however, most of it is dietary fiber. Because of this, the glycemic index of almonds is 0. The glycemic index of sunflower seeds is 20, which is considered a low GI.
Macronutrients
As the chart below indicates, both almonds and sunflower seeds consist of fats generally. However, sunflower seeds are a little higher in fats than almonds. Please, read the more detailed information in the sections below.
Macronutrient Comparison
Fats
Both almond and sunflower seeds are rich in healthy fats. They both fall in the range of the top 3% of foods as a source of fat. In contrast, they both have high polyunsaturated fats (healthy fats) and low saturated fats.
Cholesterol
Both almonds and sunflower seeds have no cholesterol.
Fat Type Comparison
Contains
more
Poly. FatPolyunsaturated fat
+87.7%
Contains
less
Sat. FatSaturated fat
-14.7%
Contains
more
Mono. FatMonounsaturated fat
+70.3%
Carbs
Both almonds and sunflower seeds have relatively high carb content. Almonds have 21.55g per 100g (of which 9g are net carbs), and sunflower seeds have 20g per 100g (of which 11.4 g are net carbs).
Fiber
Both contain high fiber. However, in comparison, almond has more fiber. It falls in the range of the top 9% of foods as a source of fiber.
Health Impact
Weight Loss and Diets
Almonds and sunflower seeds are very high in calories. Nevertheless, they can play an essential role in a healthy diet, as they are rich in dietary fiber, protein, and healthy fats. Various studies have concluded that including almonds in reduced-calorie diets leads to a more desirable and healthier weight loss than the hypocaloric diets without these nuts (1). Besides, almonds and sunflower seeds have a low glycemic index, which is good in the case of Low GI or Medium GI diets.
Cardiovascular Health
Research shows (2) that nut consumption has a significant positive effect on cardiovascular health, reducing coronary heart disease and sudden cardiac death and ameliorating risk factors by decreasing body weight and blood cholesterol.
One study (3) indicates that daily consumption of 42.5g of almonds may help prevent cardiovascular disease in the short term and potentially long term.
Sunflower seeds and almonds are rich in vitamin E, an antioxidant that helps prevent the oxidation of LDL (“bad” cholesterol) and reduces the risk of atherosclerosis, the main cause of coronary heart disease.
Another study (4) found that a compound in sunflower seeds inhibits an enzyme that causes blood vessels to constrict. As a result, it may aid in the relaxation of your blood vessels, lowering your blood pressure. Sunflower seeds also contain magnesium, which helps to lower blood pressure.
Diabetes
According to research (5), eating 1 ounce (30 grams) of sunflower seeds daily as part of a healthy diet can reduce fasting blood sugar by about 10% in six months compared to a healthy diet alone.
One study (6) indicates that seeds like sunflower and flax seeds have a role in reducing glucose levels and can be used to treat type 2 diabetes. The bioactive components in these seeds, like chlorogenic acid and phytoestrogen, can be involved in treating insulin resistance or insulin production.
Inflammation
Chronic inflammation can cause a wide range of health problems, such as type 2 diabetes, heart disease, and metabolic issues. C-reactive protein is a marker of inflammation. A study shows that sunflower seed consumption lowers C-reactive protein levels, thus probably fighting inflammation (11).
Besides, vitamin E - a natural antioxidant that is abundant in sunflower seeds and almonds, may also be beneficial in this aspect.
Side Effects
Allergy
Those who have common food allergies might also be allergic to almonds. Sunflower seed allergies are more common in people who work with sunflower plants or seeds, such as sunflower farmers and bird breeders. Commonly, symptoms can include vomiting, nausea, diarrhea, oral allergy syndrome, and, in rare cases, anaphylactic shock (7) (8).
Phytic Acid
Certain nuts, legumes, and oils contain phytic acid. This substance may bind to micronutrients like zinc and iron, preventing absorption. The consumption of phytic acid-rich foods can result in iron and zinc deficiencies, resulting in anemia, growth stagnation, and impaired immune functions. Almonds tend to be higher in phytic acid than other nuts (9).
Cadmium
Cadmium is abundant in sunflower seeds. If you are exposed to high levels of this heavy metal for an extended period, it can harm your kidneys.
Sunflowers absorb cadmium from the soil and deposit it in their seeds more significantly than most other foods. So be mindful of sunflower seed consumption [10].
Video Summary
References
- https://www.ncbi.nlm.nih.gov/pmc/articles/PMC5715655/
- https://www.ncbi.nlm.nih.gov/pmc/articles/PMC3257681/
- https://bmcpublichealth.biomedcentral.com/articles/10.1186/s12889-020-08642-4
- https://pubmed.ncbi.nlm.nih.gov/29086881/
- https://pubmed.ncbi.nlm.nih.gov/24959542/
- https://pubmed.ncbi.nlm.nih.gov/34540481/
- https://www.ncbi.nlm.nih.gov/pmc/articles/PMC7811165/
- https://pubmed.ncbi.nlm.nih.gov/11080721/
- https://www.ncbi.nlm.nih.gov/pmc/articles/PMC4325021/
- https://pubmed.ncbi.nlm.nih.gov/29580822/
- https://pubmed.ncbi.nlm.nih.gov/16357111/

Infographic
All nutrients comparison - raw data values
| Nutrient | |
|
DV% diff. |
| Vitamin B1 | 1.48mg | 0.205mg | 106% |
| Vitamin B6 | 1.345mg | 0.137mg | 93% |
| Selenium | 53µg | 4.1µg | 89% |
| Copper | 1.8mg | 1.031mg | 85% |
| Polyunsaturated fat | 23.137g | 12.329g | 72% |
| Vitamin E | 35.17mg | 25.63mg | 64% |
| Vitamin B2 | 0.355mg | 1.138mg | 60% |
| Folate | 227µg | 44µg | 46% |
| Monounsaturated fat | 18.528g | 31.551g | 33% |
| Vitamin B3 | 8.335mg | 3.618mg | 29% |
| Phosphorus | 660mg | 481mg | 26% |
| Calcium | 78mg | 269mg | 19% |
| Iron | 5.25mg | 3.71mg | 19% |
| Zinc | 5mg | 3.12mg | 17% |
| Fiber | 8.6g | 12.5g | 16% |
| Magnesium | 325mg | 270mg | 13% |
| Vitamin B5 | 1.13mg | 0.471mg | 13% |
| Manganese | 1.95mg | 2.179mg | 10% |
| Potassium | 645mg | 733mg | 3% |
| Saturated fat | 4.455g | 3.802g | 3% |
| Fats | 51.46g | 49.93g | 2% |
| Vitamin C | 1.4mg | 0mg | 2% |
| Protein | 20.78g | 21.15g | 1% |
| Carbs | 20g | 21.55g | 1% |
| Choline | 55.1mg | 52.1mg | 1% |
| Calories | 584kcal | 579kcal | 0% |
| Protein per 100 calories | 3.6g | 3.7g | N/A |
| Calories per 10 g protein | 281kcal | 274kcal | N/A |
| Weight per 100 calories | 17g | 17g | N/A |
| Unsaturated / Saturated Fat ratio | 9.4 | 12 | N/A |
| Net carbs | 11.4g | 9.05g | N/A |
| Sugar | 2.62g | 4.35g | N/A |
| Starch | 0.72g | 0% | |
| Sodium | 9mg | 1mg | 0% |
| Vitamin A | 3µg | 0µg | 0% |
| Trans fat | 0.015g | N/A | |
| Tryptophan | 0.348mg | 0.211mg | 0% |
| Threonine | 0.928mg | 0.601mg | 0% |
| Isoleucine | 1.139mg | 0.751mg | 0% |
| Leucine | 1.659mg | 1.473mg | 0% |
| Lysine | 0.937mg | 0.568mg | 0% |
| Methionine | 0.494mg | 0.157mg | 0% |
| Phenylalanine | 1.169mg | 1.132mg | 0% |
| Valine | 1.315mg | 0.855mg | 0% |
| Histidine | 0.632mg | 0.539mg | 0% |
| Fructose | 0.11g | 0% | |
| Omega-3 - EPA | 0.014g | 0g | N/A |
| Omega-3 - ALA | 0.003g | N/A | |
| Omega-6 - Eicosadienoic acid | 0g | 0.002g | N/A |
| Omega-6 - Linoleic acid | 12.32g | N/A |
Carbohydrate type comparison
| Contains more StarchStarch | +∞% |
| Contains more SucroseSucrose | +58% |
| Contains more GlucoseGlucose | +∞% |
| Contains more FructoseFructose | +∞% |
| Contains more MaltoseMaltose | +∞% |
| Contains more GalactoseGalactose | +∞% |
People also compare


References
All the values for which the sources are not specified explicitly are taken from FDA’s Food Central. The exact link to the food presented on this page can be found below.
- Sunflower seeds - https://fdc.nal.usda.gov/fdc-app.html#/food-details/170562/nutrients
- Almonds - https://fdc.nal.usda.gov/fdc-app.html#/food-details/170567/nutrients
All the Daily Values are presented for males aged 31-50, for 2000-calorie diets.