Sunflower seeds nutrition: calories, carbs, GI, protein, fiber, fats
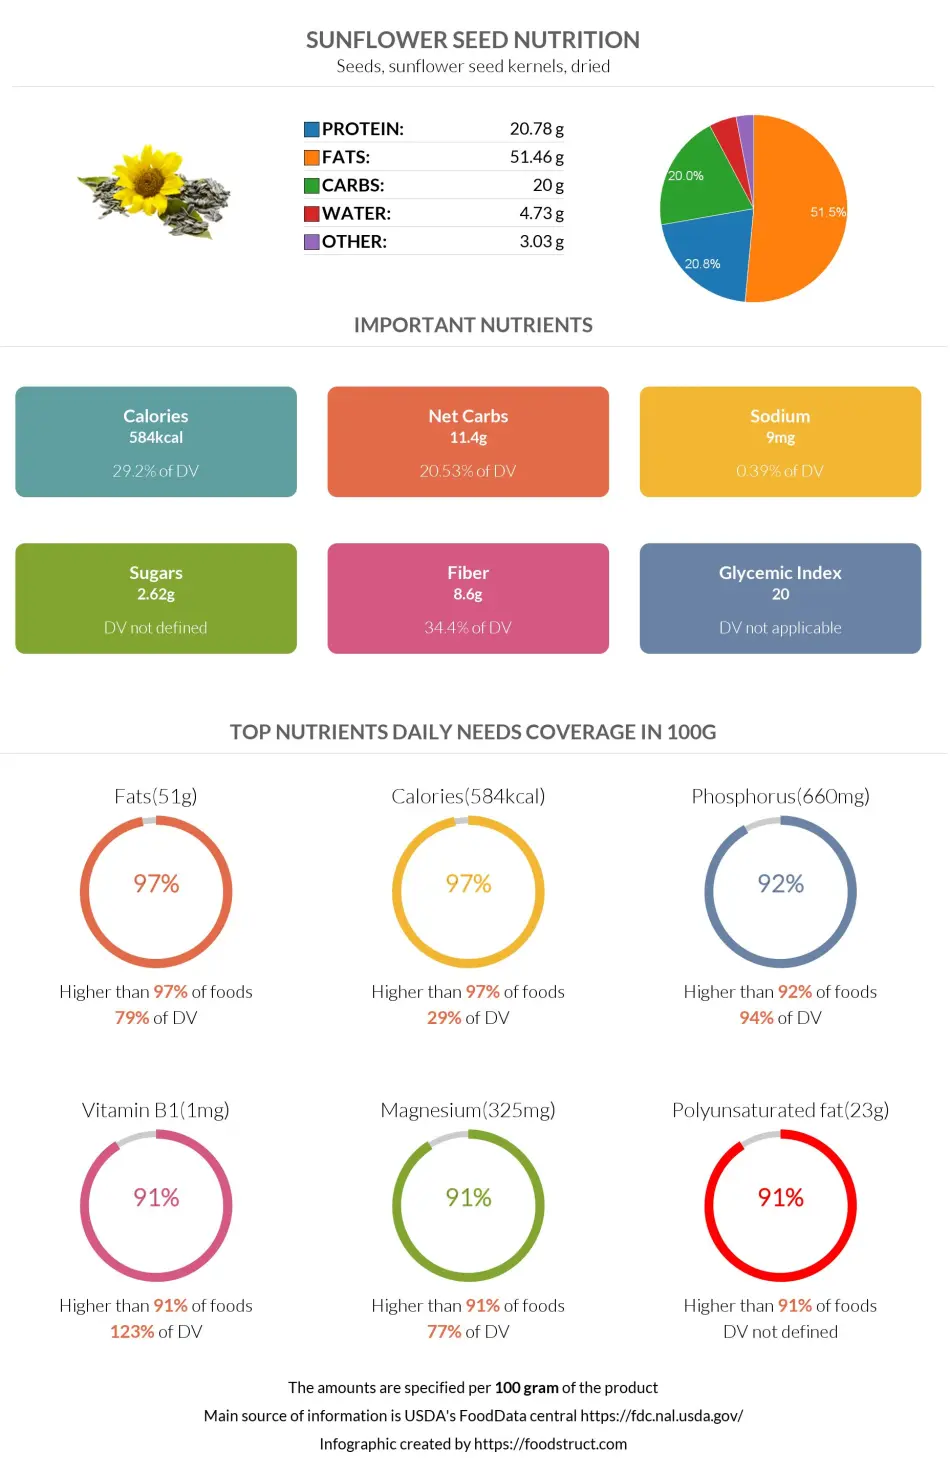
Seeds, sunflower seed kernels, dried
*all the values are displayed for the amount of 100 grams
Top nutrition facts for Sunflower seeds
| Calories ⓘ Calories for selected serving | 584 kcal |
| Net carbs ⓘ Net Carbs = Total Carbohydrates – Fiber – Sugar Alcohols | 11 g |
| Glycemic load ⓘ Glycemic Load (GL) is a metric that measures both the quality (Glycemic Index) and quantity of carbohydrates in a specific serving of food to estimate its impact on blood sugar levels. It is calculated as: (GI × Carbs in grams) / 100. | 1 (low) |
| Fiber | 8.6 g |
| Vitamin E | 35.17 mg |
| Unsaturated / Saturated Fat ratio ⓘ (monounsaturated + polyunsaturated) / saturated, ≥2 broadly recommended by major guidelines for heart health | 9.4 |
| Default serving size ⓘ Serving sizes are mostly taken from FDA's Reference Amounts Customarily Consumed (RACCs) | 1 cup, with hulls, edible yield (46 g) |
Magnesium ⓘHigher in Magnesium content than 99% of foods
Vitamin E ⓘHigher in Vitamin E content than 99% of foods
Copper ⓘHigher in Copper content than 99% of foods
Polyunsaturated fat ⓘHigher in Polyunsaturated fat content than 98% of foods
Phosphorus ⓘHigher in Phosphorus content than 98% of foods

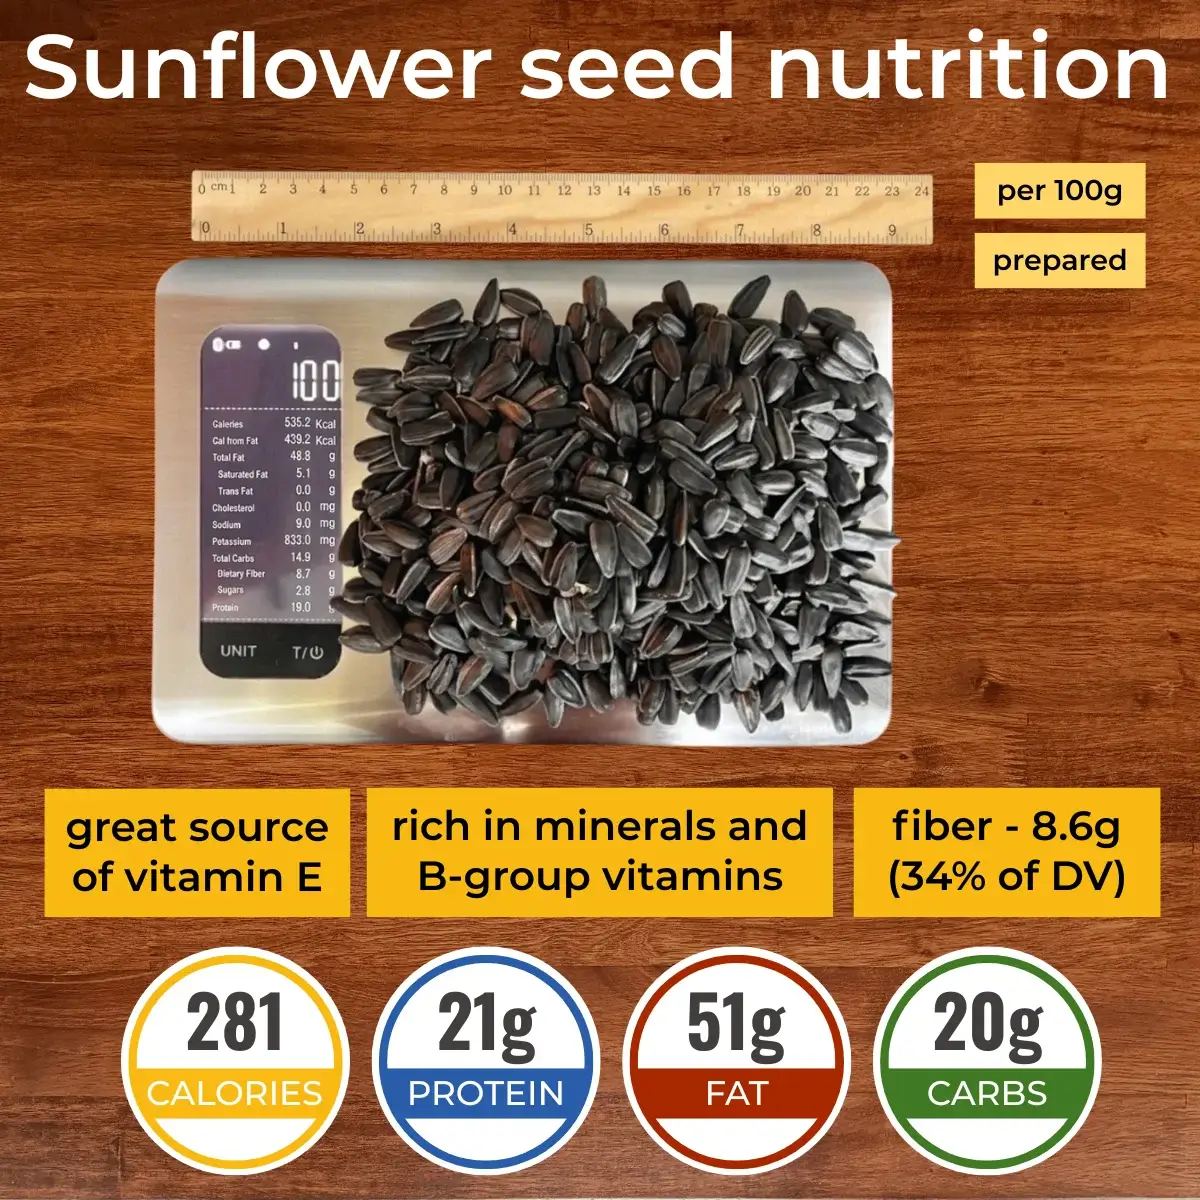
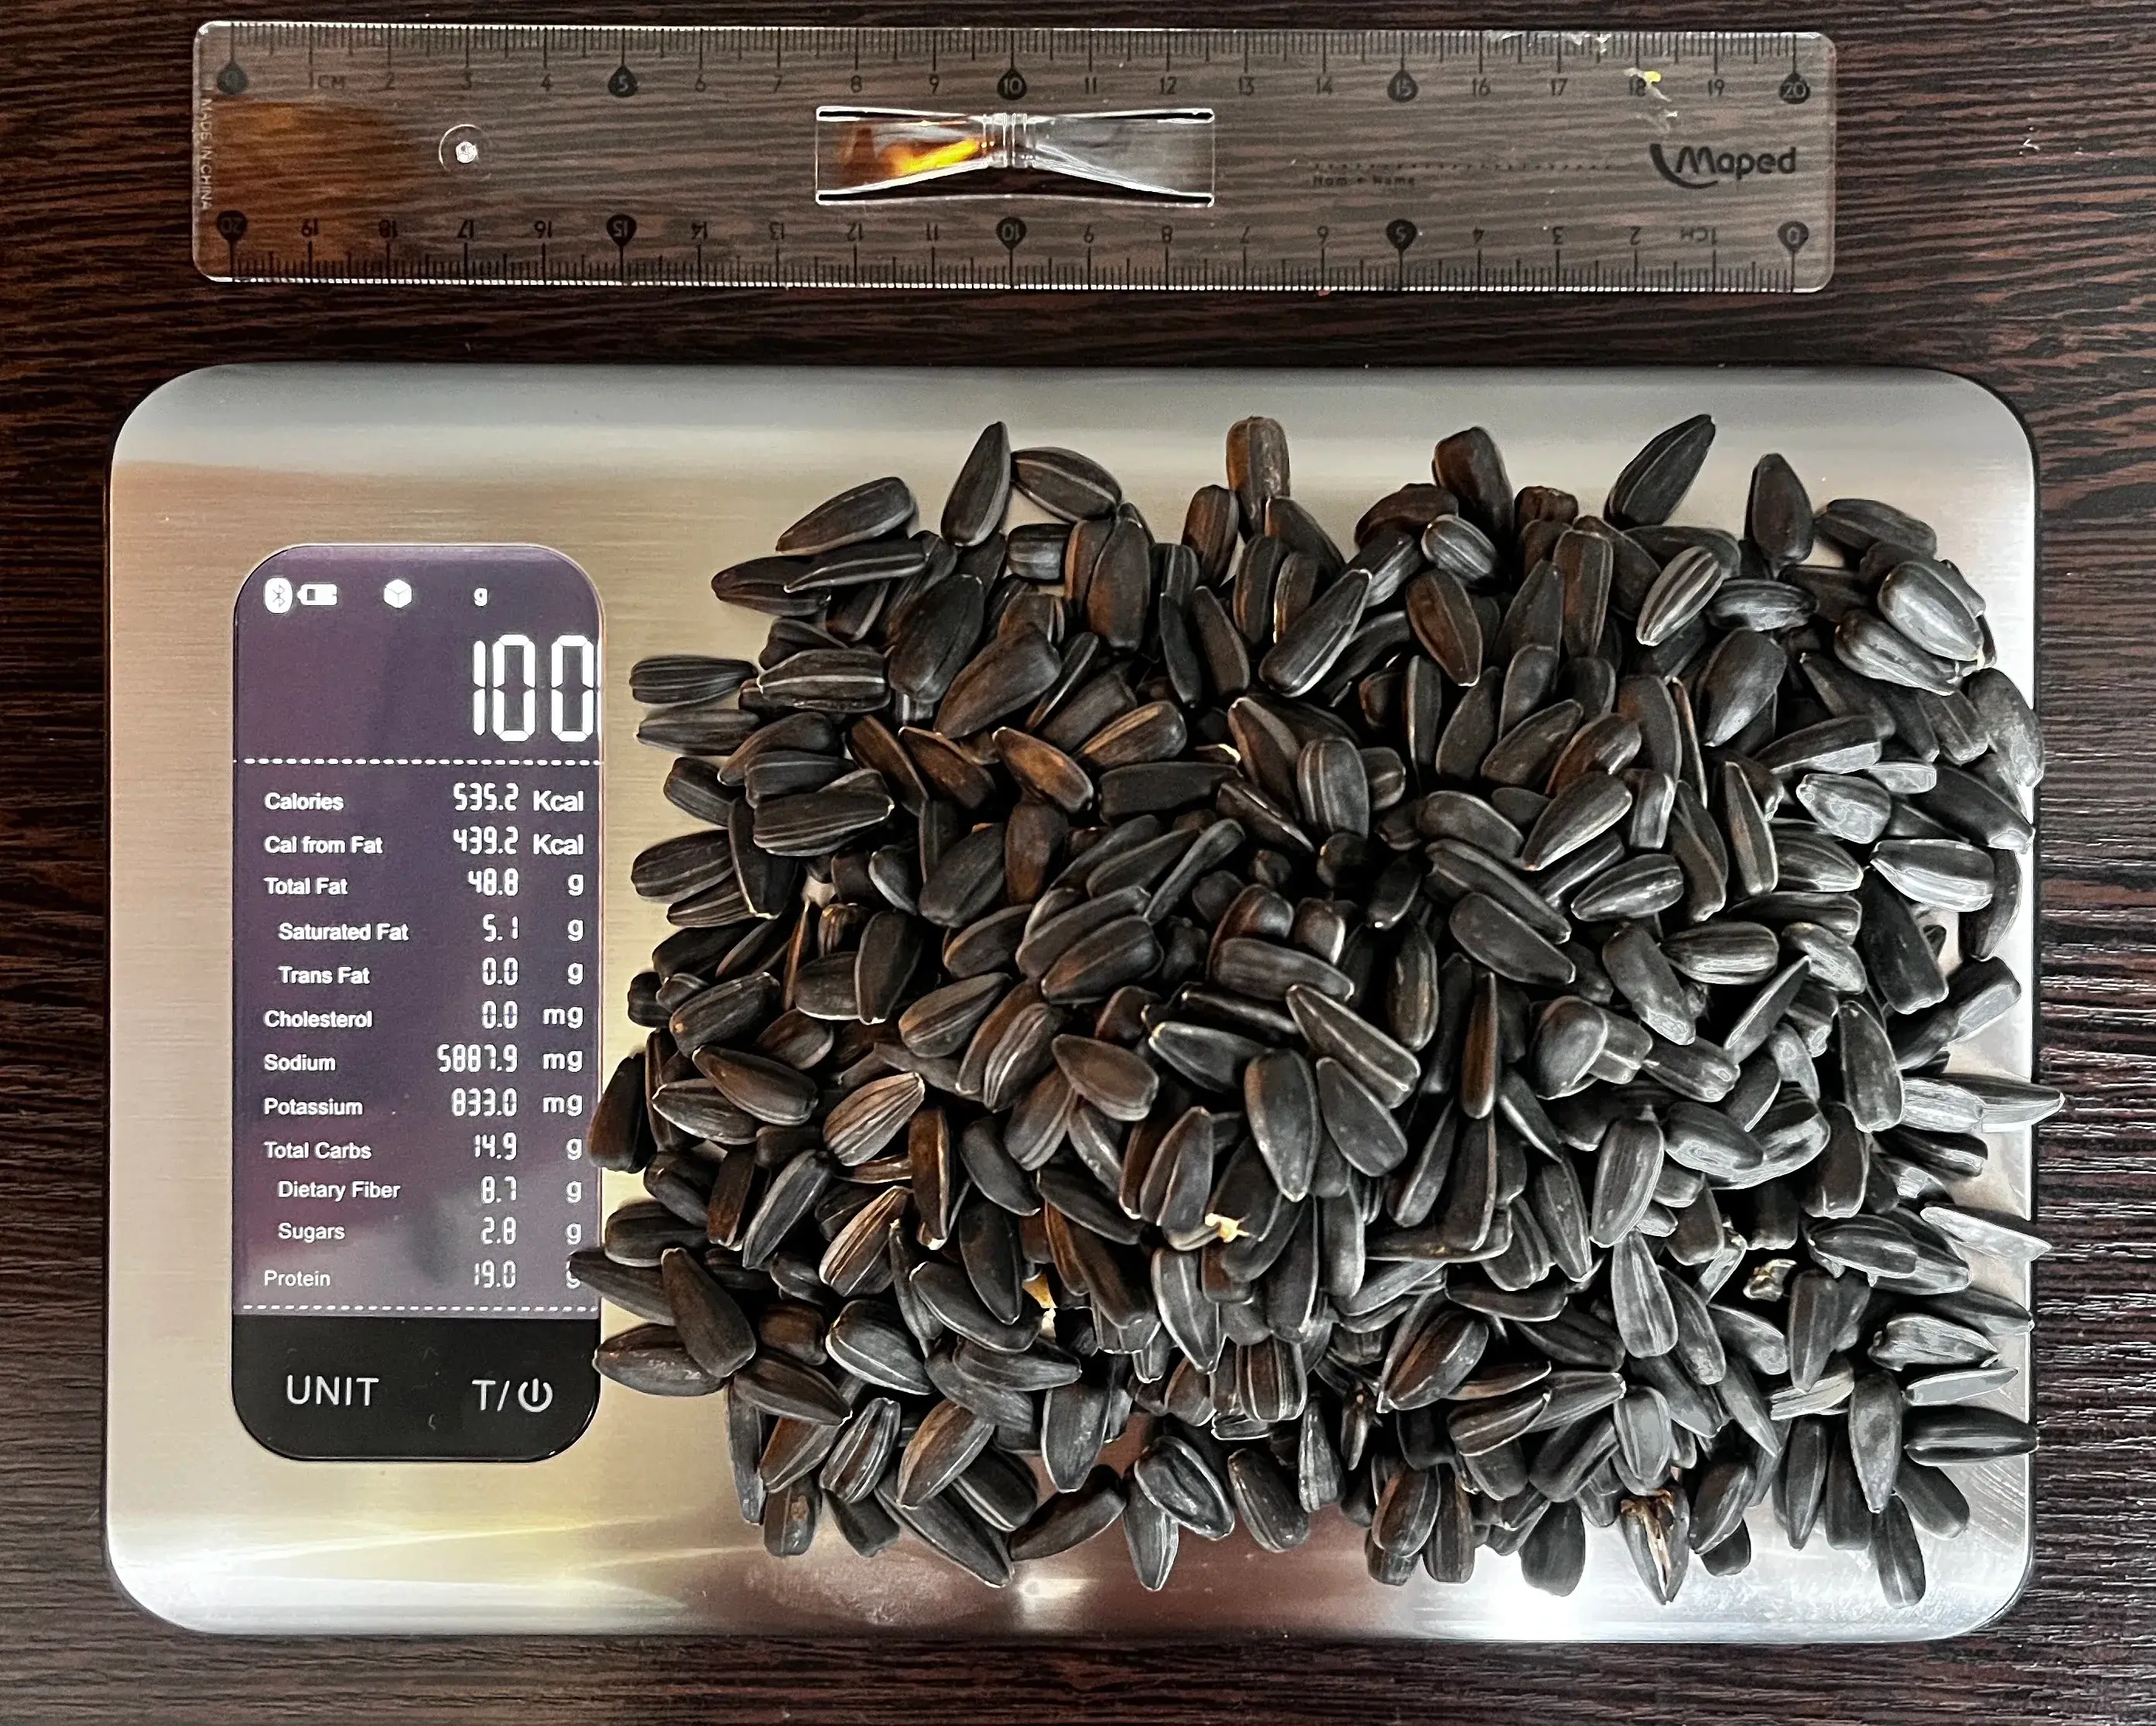
What Do 535 Calories or 100 Grams of Sunflower Seeds Look Like?
The picture below features what 535–584 calories or 100 grams of sunflower seeds look like, depending on the type, giving a visual reference for their weight and energy content. A typical serving size is 1 cup with hulls, edible yield 46 g, which provides around 246–269 calories. For example, ranch-flavored sunflower seeds contain about 584 calories per 100 grams. Remember that calorie content may vary slightly depending on the variety and roasting method. The picture shows whole, roasted sunflower seeds without salt.
Sunflower seeds calories (kcal)
| Calories for different serving sizes of sunflower seeds | Calories | Weight |
|---|---|---|
| Calories in 100 grams | 584 | |
| Calories in 1 cup, with hulls, edible yield | 269 | 46 g |
| Calories in 1 cup | 818 | 140 g |
| Calories for different varieties of sunflower seeds | Calories | Weight |
|---|---|---|
| Seeds, sunflower seed kernels, dried (this food) | 584 | 100 g |
| Seeds, sunflower seed kernels, dry roasted, without salt | 582 | 100 g |
| Seeds, sunflower seed kernels, dry roasted, with salt added | 582 | 100 g |
| Seeds, sunflower seed kernels, oil roasted, without salt | 592 | 100 g |
| Seeds, sunflower seed kernels, oil roasted, with salt added | 592 | 100 g |
| Seeds, sunflower seed kernels, toasted, without salt | 619 | 100 g |
| Seeds, sunflower seed kernels, toasted, with salt added | 619 | 100 g |
Extra Nutrition facts for Sunflower seeds
| Protein per 100 calories ⓘ Shows how many grams of protein you get from 100 calories of this food, calculated as (protein in g ÷ calories) × 100. | 3.6 g |
| Calories per 10 g protein ⓘ Shows how many calories you need to eat from this food to get 10 g of protein, calculated as (calories ÷ protein in g) × 10. | 281 kcal |
| Weight per 100 calories ⓘ Shows how many grams of this food equal 100 kcal—higher grams mean a larger portion for the same calories. | 17 g |
| Acidity (Based on PRAL) ⓘ PRAL (Potential renal acid load) is calculated using a formula. On the PRAL scale the higher the positive value, the more is the acidifying effect on the body. The lower the negative value, the higher the alkalinity of the food. 0 is neutral. | 11.6 (acidic) |
| Oxalates | 0 mg ⓘ https://www.sciencedirect.com/science/article/abs/pii/S0889157513000902 |
| Processing score ⓘ The processing score is a calculated value that looks at both how industrially made it is (NOVA) and how healthy/unprocessed the ingredients are (SIGA), then combines them into one score from 1 (least processed) to 4 (most processed). | 1 - Unprocessed ⓘ NOVA score = 1, SIGA score = A0 |
Sunflower seeds Glycemic index (GI)
Gi values are taken from various scientific sources. GI values less than 55 are considered as low. Values above 70 are considered as high.
Sunflower seeds Glycemic load (GL)
Mineral coverage chart
Mineral chart - relative view
Vitamin coverage chart
Vitamin A:
9µg of 900µg
1%
Vitamin E:
106mg of 15mg
703%
Vitamin D:
0µg of 20µg
0%
Vitamin C:
4.2mg of 90mg
4.7%
Vitamin B1:
4.4mg of 1mg
370%
Vitamin B2:
1.1mg of 1mg
82%
Vitamin B3:
25mg of 16mg
156%
Vitamin B5:
3.4mg of 5mg
68%
Vitamin B6:
4mg of 1mg
310%
Folate:
681µg of 400µg
170%
Vitamin B12:
0µg of 2µg
0%
Vitamin K:
0µg of 120µg
0%
Vitamin chart - relative view
Macronutrients chart
Protein:
Daily Value: 42%
20.8 g of 50 g
20.8 g (42% of DV )
Fats:
Daily Value: 79%
51.5 g of 65 g
51.5 g (79% of DV )
Carbs:
Daily Value: 7%
20 g of 300 g
20 g (7% of DV )
Water:
Daily Value: 0%
4.7 g of 2,000 g
4.7 g (0% of DV )
Other:
3 g
3 g
Protein quality breakdown
Tryptophan:
1044mg of 280mg
373%
Threonine:
2784mg of 1,050mg
265%
Isoleucine:
3417mg of 1,400mg
244%
Leucine:
4977mg of 2,730mg
182%
Lysine:
2811mg of 2,100mg
134%
Methionine:
1482mg of 1,050mg
141%
Phenylalanine:
3507mg of 1,750mg
200%
Valine:
3945mg of 1,820mg
217%
Histidine:
1896mg of 700mg
271%
Fat type information
Saturated fat:
4.5 g
Monounsaturated fat:
19 g
Polyunsaturated fat:
23 g
Carbohydrate type breakdown
Starch:
0 g
Sucrose:
2.5 g
Glucose:
0 g
Fructose:
0 g
Lactose:
0 g
Maltose:
0 g
Galactose:
0 g
Fiber content ratio for Sunflower seeds
Sugar:
2.6 g
Fiber:
8.6 g
Other:
8.8 g
All nutrients for Sunflower seeds per 100g
| Nutrient | Value | DV% | In TOP % of foods | Comparison |
| Vitamin A | 3µg | 0% | 45% | |
| Calories | 584kcal | 29% | 3% |
12.4 times more than Orange
|
| Weight per 100 calories | 17g | N/A | 97% | |
| Protein per 100 calories | 3.6g | N/A | 55% | |
| Protein | 21g | 49% | 23% |
7.4 times more than Broccoli
|
| Calories per 10 g protein | 281kcal | N/A | 42% | |
| Fats | 51g | 79% | 4% |
1.5 times more than Cheese
|
| Unsaturated / Saturated Fat ratio | 9.4 | N/A | 2% | |
| Vitamin C | 1.4mg | 2% | 30% |
37.9 times less than Lemon
|
| Carbs | 20g | 7% | 35% |
1.4 times less than Rice
|
| Net carbs | 11g | N/A | 44% |
4.8 times less than Chocolate
|
| Cholesterol | 0mg | 0% | 100% |
N/A
|
| Vitamin D* | 0 IU | 0% | 100% |
N/A
|
| Vitamin D | 0µg | 0% | 100% |
N/A
|
| Magnesium | 325mg | 77% | 1% |
2.3 times more than Almonds
|
| Calcium | 78mg | 8% | 22% |
1.6 times less than Milk
|
| Potassium | 645mg | 19% | 5% |
4.4 times more than Cucumber
|
| Iron | 5.3mg | 66% | 9% |
2 times more than Beef broiled
|
| Sugar | 2.6g | N/A | 36% |
3.4 times less than Coca-Cola
|
| Fiber | 8.6g | 34% | 6% |
3.6 times more than Orange
|
| Copper | 1.8mg | 200% | 1% |
12.7 times more than Shiitake
|
| Zinc | 5mg | 45% | 11% |
1.3 times less than Beef broiled
|
| Phosphorus | 660mg | 94% | 2% |
3.6 times more than Chicken meat
|
| Sodium | 9mg | 0% | 85% |
54.4 times less than White bread
|
| Vitamin E | 35mg | 234% | 1% |
24.1 times more than Kiwi
|
| Manganese | 2mg | 85% | 4% | |
| Selenium | 53µg | 96% | 2% | |
| Vitamin B1 | 1.5mg | 123% | 2% |
5.6 times more than Pea raw
|
| Vitamin B2 | 0.36mg | 27% | 14% |
2.7 times more than Avocado
|
| Vitamin B3 | 8.3mg | 52% | 8% |
1.1 times less than Turkey meat
|
| Vitamin B5 | 1.1mg | 23% | 8% |
Equal to Sunflower seeds
|
| Vitamin B6 | 1.3mg | 103% | 3% |
11.3 times more than Oats
|
| Vitamin B12 | 0µg | 0% | 100% |
N/A
|
| Vitamin K | 0µg | 0% | 100% |
N/A
|
| Folate | 227µg | 57% | 4% |
3.7 times more than Brussels sprouts
|
| Saturated fat | 4.5g | 22% | 24% |
1.3 times less than Beef broiled
|
| Choline | 55mg | 10% | 19% | |
| Monounsaturated fat | 19g | N/A | 4% |
1.9 times more than Avocado
|
| Polyunsaturated fat | 23g | N/A | 2% |
2 times less than Walnut
|
| Tryptophan | 0.35mg | 0% | 4% |
1.1 times more than Chicken meat
|
| Threonine | 0.93mg | 0% | 19% |
1.3 times more than Beef broiled
|
| Isoleucine | 1.1mg | 0% | 13% |
1.2 times more than Salmon raw
|
| Leucine | 1.7mg | 0% | 20% |
1.5 times less than Tuna Bluefin
|
| Lysine | 0.94mg | 0% | 31% |
2.1 times more than Tofu
|
| Methionine | 0.49mg | 0% | 24% |
5.1 times more than Quinoa
|
| Phenylalanine | 1.2mg | 0% | 6% |
1.8 times more than Egg
|
| Valine | 1.3mg | 0% | 11% |
1.5 times less than Soybean raw
|
| Histidine | 0.63mg | 0% | 22% |
1.2 times less than Turkey meat
|
| Caffeine | 0mg | 0% | 100% | |
| Omega-3 - EPA | 0.01g | N/A | 6% |
49.3 times less than Salmon
|
| Omega-3 - DHA | 0g | N/A | 100% |
N/A
|
| Omega-3 - DPA | 0g | N/A | 100% |
N/A
|
| Omega-6 - Eicosadienoic acid | 0g | N/A | 100% |
Check out similar food or compare with current
NUTRITION FACTS LABEL
Nutrition Facts
___servings per container
Serving Size ______________
Serving Size ______________
Amount Per 100g
Calories 584
% Daily Value*
79%
Total Fat
51g
20%
Saturated Fat 4.5g
0
Trans Fat
0g
0
Cholesterol 0mg
0.39%
Sodium 9mg
6.7%
Total Carbohydrate
20g
34%
Dietary Fiber
8.6g
Total Sugars 0g
Includes ? g Added Sugars
Protein
21g
Vitamin D
0mcg
0
Calcium
78mg
7.8%
Iron
5.3mg
66%
Potassium
645mg
19%
*
The % Daily Value (DV) tells you how much a nutrient in a serving of food contributes to a daily diet. 2,000 calories a day is used for general nutrition advice.
Health checks
ⓘ
Dietary cholesterol is not associated with an increased risk of coronary heart disease in healthy individuals. However, dietary cholesterol is common in foods that are high in harmful saturated fats.
Source
Low in Cholesterol
ⓘ
Trans fat consumption increases the risk of cardiovascular disease and mortality by negatively affecting blood lipid levels.
Source
No Trans Fats
ⓘ
Saturated fat intake can raise total cholesterol and LDL (low-density lipoprotein) levels, leading to an increased risk of atherosclerosis. Dietary guidelines recommend limiting saturated fats to under 10% of calories a day.
Source
Low in Saturated Fats
ⓘ
While the consumption of moderate amounts of added sugars is not detrimental to health, an excessive intake can increase the risk of obesity, and therefore, diabetes.
Source
Low in Sugars
Sunflower seeds nutrition infographic
Infographic link
References
All the values for which the sources are not specified explicitly are taken from FDA’s Food Central. The exact link to the food presented on this page can be found below.