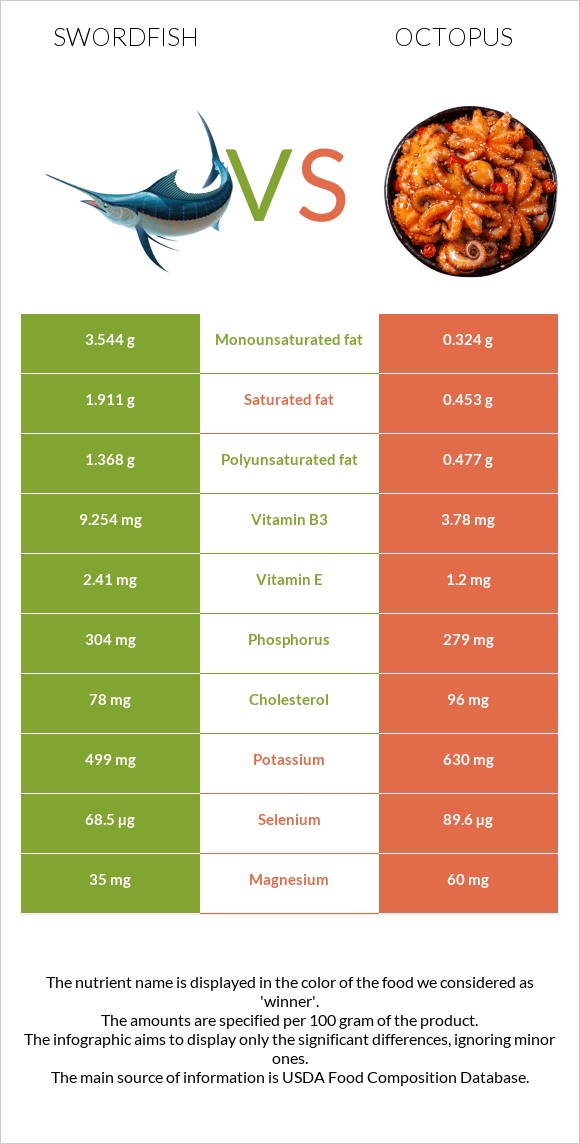
Differences between swordfish and octopus Swordfish is higher in vitamin D* and vitamin B3; however, octopus is richer in vitamin B12, iron, copper, selenium, zinc, calcium, and vitamin B5. Octopus's daily need coverage for vitamin B12 is 1433% higher. Swordfish has less sodium. The food types used in this comparison are Fish, swordfish, cooked, dry heat and Mollusks, octopus, common, cooked, moist heat .
Infographic
Mineral Comparison
Mineral comparison score is based on the number of minerals by which one or the other food is richer. The "coverage" charts below show how much of the daily needs can be covered by 300 grams of the food.
1
100 g
300 g
3 oz - 85g 1 piece - 106g
Magnesium
Magnesium
Calcium
Calcium
Potassium
Potassium
Iron
Iron
Copper
Copper
Zinc
Zinc
Phosphorus
Phosphorus
Sodium
Sodium
Manganese
Manganese
Selenium
Selenium
25%
1.8%
44%
17%
15%
21%
130%
13%
1.7%
374%
8
100 g
300 g
3 oz - 85g
Magnesium
Magnesium
Calcium
Calcium
Potassium
Potassium
Iron
Iron
Copper
Copper
Zinc
Zinc
Phosphorus
Phosphorus
Sodium
Sodium
Manganese
Manganese
Selenium
Selenium
43%
32%
56%
358%
246%
92%
120%
60%
6.1%
489%
Vitamin Comparison
Vitamin comparison score is based on the number of vitamins by which one or the other food is richer. The "coverage" charts below show how much of the daily needs can be covered by 300 grams of the food.
4
100 g
300 g
3 oz - 85g 1 piece - 106g
Vitamin C
Vit. C
Vitamin D
Vit. D
Vitamin A
Vit. A
Vitamin E
Vit. E
Vitamin B1
Vit. B1
Vitamin B2
Vit. B2
Vitamin B3
Vit. B3
Vitamin B5
Vit. B5
Vitamin B6
Vit. B6
Vitamin B12
Vit. B12
Vitamin K
Vit. K
Folate
Folate
0%
249%
14%
48%
22%
15%
174%
25%
142%
203%
0.25%
1.5%
6
100 g
300 g
3 oz - 85g
Vitamin C
Vit. C
Vitamin D
Vit. D
Vitamin A
Vit. A
Vitamin E
Vit. E
Vitamin B1
Vit. B1
Vitamin B2
Vit. B2
Vitamin B3
Vit. B3
Vitamin B5
Vit. B5
Vitamin B6
Vit. B6
Vitamin B12
Vit. B12
Vitamin K
Vit. K
Folate
Folate
27%
0%
30%
24%
14%
18%
71%
54%
150%
4500%
0.25%
18%
All nutrients comparison - raw data values
Nutrient
DV% diff.
Vitamin B12
1.62µg
36µg
1433%
Iron
0.45mg
9.54mg
114%
Vitamin D*
666 IU
0 IU
83%
Vitamin D
16.6µg
0µg
83%
Copper
0.046mg
0.739mg
77%
Selenium
68.5µg
89.6µg
38%
Vitamin B3
9.254mg
3.78mg
34%
Zinc
0.78mg
3.36mg
23%
Sodium
97mg
460mg
16%
Protein
23.45g
29.82g
13%
Calcium
6mg
106mg
10%
Vitamin B5
0.417mg
0.9mg
10%
Fats
7.93g
2.08g
9%
Vitamin C
0mg
8mg
9%
Vitamin E
2.41mg
1.2mg
8%
Monounsaturated fat
3.544g
0.324g
8%
Saturated fat
1.911g
0.453g
7%
Cholesterol
78mg
96mg
6%
Magnesium
35mg
60mg
6%
Folate
2µg
24µg
6%
Polyunsaturated fat
1.368g
0.477g
6%
Vitamin A
43µg
90µg
5%
Potassium
499mg
630mg
4%
Phosphorus
304mg
279mg
4%
Vitamin B1
0.089mg
0.057mg
3%
Vitamin B6
0.615mg
0.648mg
3%
Carbs
0g
4.4g
1%
Manganese
0.013mg
0.047mg
1%
Vitamin B2
0.063mg
0.076mg
1%
Choline
77.5mg
81mg
1%
Calories
172kcal
164kcal
0%
Protein per 100 calories
14g
18g
N/A
Calories per 10 g protein
73kcal
55kcal
N/A
Weight per 100 calories
58g
61g
N/A
Unsaturated / Saturated Fat ratio
2.6
1.8
N/A
Net carbs
0g
4.4g
N/A
Vitamin K
0.1µg
0.1µg
0%
Trans fat
0.056g
N/A
Tryptophan
0.265mg
0.334mg
0%
Threonine
1.035mg
1.283mg
0%
Isoleucine
1.088mg
1.298mg
0%
Leucine
1.919mg
2.099mg
0%
Lysine
2.168mg
2.228mg
0%
Methionine
0.699mg
0.673mg
0%
Phenylalanine
0.922mg
1.069mg
0%
Valine
1.216mg
1.303mg
0%
Histidine
0.695mg
0.573mg
0%
Omega-3 - EPA
0.127g
0.152g
N/A
Omega-3 - DHA
0.772g
0.162g
N/A
Omega-3 - DPA
0.168g
0.012g
N/A
Omega-6 - Eicosadienoic acid
0.022g
N/A
Macronutrient Comparison
Macronutrient breakdown side-by-side comparison
2
23%
8%
68%
Protein:
23.45 g
Fats:
7.93 g
Carbs:
0 g
Water:
68.26 g
Other:
0.36 g
3
30%
2%
4%
61%
3%
Protein:
29.82 g
Fats:
2.08 g
Carbs:
4.4 g
Water:
60.5 g
Other:
3.2 g
Contains
more
Fats Fats
+281.3%
Contains
more
Water Water
+12.8%
Contains
more
Protein Protein
+27.2%
Contains
more
Carbs Carbs
+∞%
Contains
more
Other Other
+788.9%
Fat Type Comparison
Fat type breakdown side-by-side comparison
2
28%
52%
20%
Saturated fat:
Sat. Fat
1.911 g
Monounsaturated fat:
Mono. Fat
3.544 g
Polyunsaturated fat:
Poly. Fat
1.368 g
1
36%
26%
38%
Saturated fat:
Sat. Fat
0.453 g
Monounsaturated fat:
Mono. Fat
0.324 g
Polyunsaturated fat:
Poly. Fat
0.477 g
Contains
more
Mono. Fat Monounsaturated fat
+993.8%
Contains
more
Poly. Fat Polyunsaturated fat
+186.8%
Contains
less
Sat. Fat Saturated fat
-76.3%