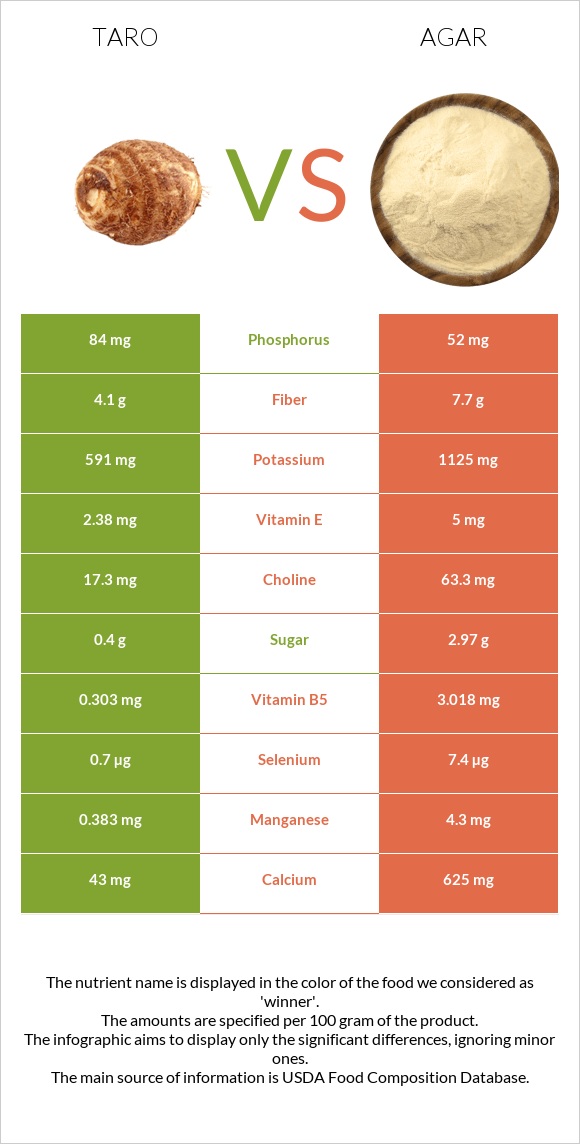
Differences between taro and agar Taro contains less iron, magnesium, manganese, folate, calcium, vitamin B5, zinc, copper, vitamin K, and vitamin E than agar. Agar's daily need coverage for iron is 261% higher. The food types used in this comparison are Taro, raw and Seaweed, agar, dried .
Infographic
Mineral Comparison
Mineral comparison score is based on the number of minerals by which one or the other food is richer. The "coverage" charts below show how much of the daily needs can be covered by 300 grams of the food.
2
100 g
300 g
1 cup, sliced - 104g
Magnesium
Magnesium
Calcium
Calcium
Potassium
Potassium
Iron
Iron
Copper
Copper
Zinc
Zinc
Phosphorus
Phosphorus
Sodium
Sodium
Manganese
Manganese
Selenium
Selenium
24%
13%
52%
21%
57%
6.3%
36%
1.4%
50%
3.8%
8
100 g
300 g
Magnesium
Magnesium
Calcium
Calcium
Potassium
Potassium
Iron
Iron
Copper
Copper
Zinc
Zinc
Phosphorus
Phosphorus
Sodium
Sodium
Manganese
Manganese
Selenium
Selenium
550%
188%
99%
803%
203%
158%
22%
13%
561%
40%
Vitamin Comparison
Vitamin comparison score is based on the number of vitamins by which one or the other food is richer. The "coverage" charts below show how much of the daily needs can be covered by 300 grams of the food.
4
100 g
300 g
1 cup, sliced - 104g
Vitamin C
Vit. C
Vitamin D
Vit. D
Vitamin A
Vit. A
Vitamin E
Vit. E
Vitamin B1
Vit. B1
Vitamin B2
Vit. B2
Vitamin B3
Vit. B3
Vitamin B5
Vit. B5
Vitamin B6
Vit. B6
Vitamin B12
Vit. B12
Vitamin K
Vit. K
Folate
Folate
15%
0%
1.3%
48%
24%
5.8%
11%
18%
65%
0%
2.5%
17%
5
100 g
300 g
Vitamin C
Vit. C
Vitamin D
Vit. D
Vitamin A
Vit. A
Vitamin E
Vit. E
Vitamin B1
Vit. B1
Vitamin B2
Vit. B2
Vitamin B3
Vit. B3
Vitamin B5
Vit. B5
Vitamin B6
Vit. B6
Vitamin B12
Vit. B12
Vitamin K
Vit. K
Folate
Folate
0%
0%
0%
100%
2.5%
51%
3.8%
181%
70%
0%
61%
435%
All nutrients comparison - raw data values
Nutrient
DV% diff.
Iron
0.55mg
21.4mg
261%
Magnesium
33mg
770mg
175%
Manganese
0.383mg
4.3mg
170%
Folate
22µg
580µg
140%
Calcium
43mg
625mg
58%
Vitamin B5
0.303mg
3.018mg
54%
Zinc
0.23mg
5.8mg
51%
Copper
0.172mg
0.61mg
49%
Vitamin K
1µg
24.4µg
20%
Carbs
26.46g
80.88g
18%
Vitamin E
2.38mg
5mg
17%
Potassium
591mg
1125mg
16%
Vitamin B2
0.025mg
0.222mg
15%
Fiber
4.1g
7.7g
14%
Selenium
0.7µg
7.4µg
12%
Calories
112kcal
306kcal
10%
Protein
1.5g
6.21g
9%
Choline
17.3mg
63.3mg
8%
Vitamin B1
0.095mg
0.01mg
7%
Vitamin C
4.5mg
0mg
5%
Phosphorus
84mg
52mg
5%
Sodium
11mg
102mg
4%
Vitamin B3
0.6mg
0.202mg
2%
Vitamin B6
0.283mg
0.303mg
2%
Protein per 100 calories
1.3g
2g
N/A
Calories per 10 g protein
747kcal
493kcal
N/A
Weight per 100 calories
89g
33g
N/A
Fats
0.2g
0.3g
0%
Net carbs
22.36g
73.18g
N/A
Sugar
0.4g
2.97g
N/A
Vitamin A
4µg
0µg
0%
Saturated fat
0.041g
0.061g
0%
Monounsaturated fat
0.016g
0.027g
0%
Polyunsaturated fat
0.083g
0.102g
0%
Tryptophan
0.023mg
0%
Threonine
0.069mg
0%
Isoleucine
0.054mg
0%
Leucine
0.111mg
0%
Lysine
0.067mg
0%
Methionine
0.02mg
0%
Phenylalanine
0.082mg
0%
Valine
0.082mg
0%
Histidine
0.034mg
0%
Omega-3 - EPA
0g
0.087g
N/A
Macronutrient Comparison
Macronutrient breakdown side-by-side comparison
1
26%
71%
Protein:
1.5 g
Fats:
0.2 g
Carbs:
26.46 g
Water:
70.64 g
Other:
1.2 g
4
6%
81%
9%
4%
Protein:
6.21 g
Fats:
0.3 g
Carbs:
80.88 g
Water:
8.68 g
Other:
3.93 g
Contains
more
Water Water
+713.8%
Contains
more
Protein Protein
+314%
Contains
more
Fats Fats
+50%
Contains
more
Carbs Carbs
+205.7%
Contains
more
Other Other
+227.5%
Fat Type Comparison
Fat type breakdown side-by-side comparison
1
29%
11%
59%
Saturated fat:
Sat. Fat
0.041 g
Monounsaturated fat:
Mono. Fat
0.016 g
Polyunsaturated fat:
Poly. Fat
0.083 g
2
32%
14%
54%
Saturated fat:
Sat. Fat
0.061 g
Monounsaturated fat:
Mono. Fat
0.027 g
Polyunsaturated fat:
Poly. Fat
0.102 g
Contains
less
Sat. Fat Saturated fat
-32.8%
Contains
more
Mono. Fat Monounsaturated fat
+68.8%
Contains
more
Poly. Fat Polyunsaturated fat
+22.9%