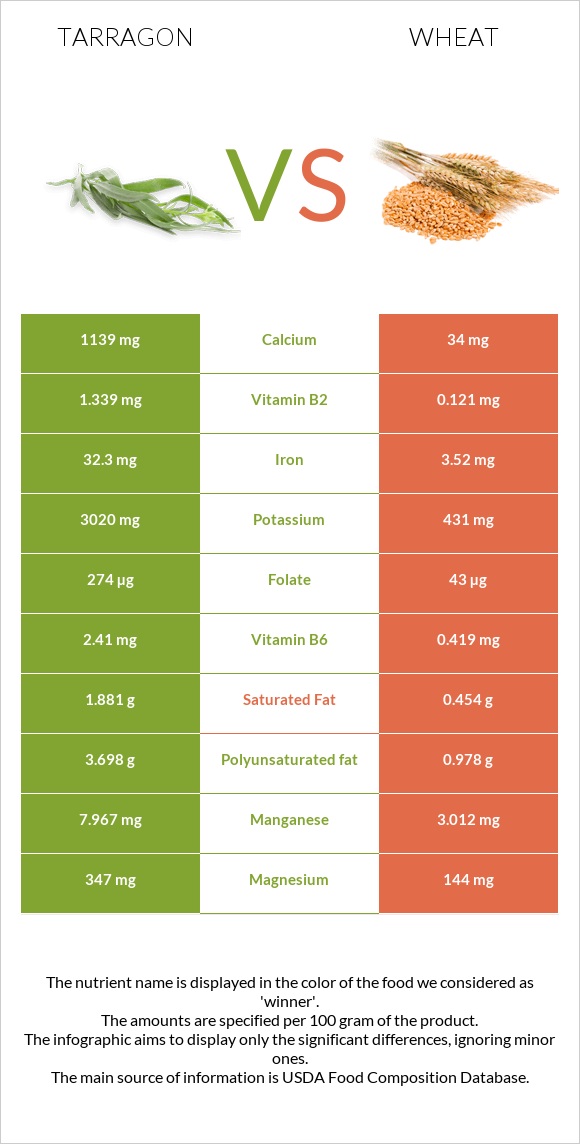
What are the differences between tarragon and wheat ? Tarragon is higher in iron, manganese, vitamin B6, calcium, vitamin B2, vitamin A, potassium, folate, and vitamin C, yet wheat is higher in selenium. Tarragon's daily need coverage for iron is 360% more. The glycemic index of tarragon is lower. We used Spices, tarragon, dried and Wheat, durum types in this article.
Infographic
Mineral Comparison
Mineral comparison score is based on the number of minerals by which one or the other food is richer. The "coverage" charts below show how much of the daily needs can be covered by 300 grams of the food.
6
100 g
300 g
0.25 tsp - 0.5g 1 tsp, ground - 1.6g 1 tbsp, leaves - 1.8g 1 tbsp, ground - 4.8g
Magnesium
Magnesium
Calcium
Calcium
Potassium
Potassium
Iron
Iron
Copper
Copper
Zinc
Zinc
Phosphorus
Phosphorus
Sodium
Sodium
Manganese
Manganese
Selenium
Selenium
248%
342%
266%
1211%
226%
106%
134%
8.1%
1039%
24%
3
100 g
300 g
1 cup - 192g
Magnesium
Magnesium
Calcium
Calcium
Potassium
Potassium
Iron
Iron
Copper
Copper
Zinc
Zinc
Phosphorus
Phosphorus
Sodium
Sodium
Manganese
Manganese
Selenium
Selenium
103%
10%
38%
132%
184%
113%
218%
0.26%
393%
488%
Vitamin Comparison
Vitamin comparison score is based on the number of vitamins by which one or the other food is richer. The "coverage" charts below show how much of the daily needs can be covered by 300 grams of the food.
6
100 g
300 g
0.25 tsp - 0.5g 1 tsp, ground - 1.6g 1 tbsp, leaves - 1.8g 1 tbsp, ground - 4.8g
Vitamin C
Vit. C
Vitamin D
Vit. D
Vitamin A
Vit. A
Vitamin E
Vit. E
Vitamin B1
Vit. B1
Vitamin B2
Vit. B2
Vitamin B3
Vit. B3
Vitamin B5
Vit. B5
Vitamin B6
Vit. B6
Vitamin B12
Vit. B12
Vitamin K
Vit. K
Folate
Folate
167%
0%
70%
0%
63%
309%
168%
0%
556%
0%
0%
206%
2
100 g
300 g
1 cup - 192g
Vitamin C
Vit. C
Vitamin D
Vit. D
Vitamin A
Vit. A
Vitamin E
Vit. E
Vitamin B1
Vit. B1
Vitamin B2
Vit. B2
Vitamin B3
Vit. B3
Vitamin B5
Vit. B5
Vitamin B6
Vit. B6
Vitamin B12
Vit. B12
Vitamin K
Vit. K
Folate
Folate
0%
0%
0%
0%
105%
28%
126%
56%
97%
0%
0%
32%
All nutrients comparison - raw data values
Nutrient
DV% diff.
Iron
32.3mg
3.52mg
360%
Manganese
7.967mg
3.012mg
215%
Selenium
4.4µg
89.4µg
155%
Vitamin B6
2.41mg
0.419mg
153%
Calcium
1139mg
34mg
111%
Vitamin B2
1.339mg
0.121mg
94%
Potassium
3020mg
431mg
76%
Folate
274µg
43µg
58%
Vitamin C
50mg
0mg
56%
Magnesium
347mg
144mg
48%
Fiber
7.4g
30%
Phosphorus
313mg
508mg
28%
Vitamin A
210µg
0µg
23%
Vitamin B5
0.935mg
19%
Protein
22.77g
13.68g
18%
Polyunsaturated fat
3.698g
0.978g
18%
Copper
0.677mg
0.553mg
14%
Vitamin B1
0.251mg
0.419mg
14%
Vitamin B3
8.95mg
6.738mg
14%
Fats
7.24g
2.47g
7%
Carbs
50.22g
71.13g
7%
Saturated fat
1.881g
0.454g
6%
Sodium
62mg
2mg
3%
Calories
295kcal
339kcal
2%
Zinc
3.9mg
4.16mg
2%
Protein per 100 calories
7.7g
4g
N/A
Calories per 10 g protein
130kcal
248kcal
N/A
Weight per 100 calories
34g
29g
N/A
Unsaturated / Saturated Fat ratio
2.2
2.9
N/A
Net carbs
42.82g
71.13g
N/A
Monounsaturated fat
0.474g
0.344g
0%
Tryptophan
0.176mg
0%
Threonine
0.366mg
0%
Isoleucine
0.533mg
0%
Leucine
0.934mg
0%
Lysine
0.303mg
0%
Methionine
0.221mg
0%
Phenylalanine
0.681mg
0%
Valine
0.594mg
0%
Histidine
0.322mg
0%
Macronutrient Comparison
Macronutrient breakdown side-by-side comparison
3
23%
7%
50%
8%
12%
Protein:
22.77 g
Fats:
7.24 g
Carbs:
50.22 g
Water:
7.74 g
Other:
12.03 g
2
14%
2%
71%
11%
2%
Protein:
13.68 g
Fats:
2.47 g
Carbs:
71.13 g
Water:
10.94 g
Other:
1.78 g
Contains
more
Protein Protein
+66.4%
Contains
more
Fats Fats
+193.1%
Contains
more
Other Other
+575.8%
Contains
more
Carbs Carbs
+41.6%
Contains
more
Water Water
+41.3%
Fat Type Comparison
Fat type breakdown side-by-side comparison
2
31%
8%
61%
Saturated fat:
Sat. Fat
1.881 g
Monounsaturated fat:
Mono. Fat
0.474 g
Polyunsaturated fat:
Poly. Fat
3.698 g
1
26%
19%
55%
Saturated fat:
Sat. Fat
0.454 g
Monounsaturated fat:
Mono. Fat
0.344 g
Polyunsaturated fat:
Poly. Fat
0.978 g
Contains
more
Mono. Fat Monounsaturated fat
+37.8%
Contains
more
Poly. Fat Polyunsaturated fat
+278.1%
Contains
less
Sat. Fat Saturated fat
-75.9%