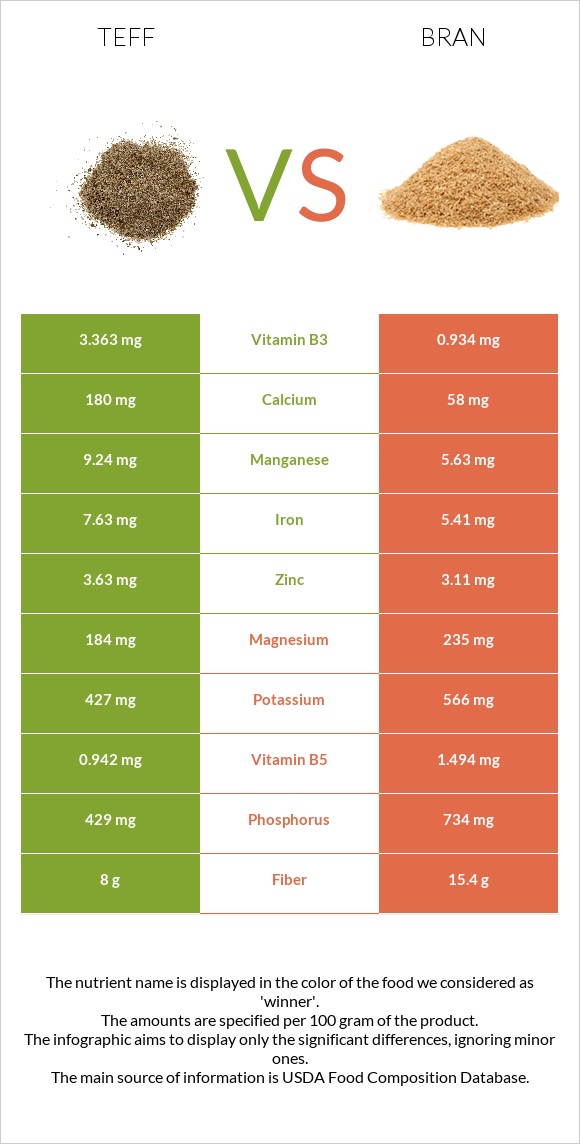
What are the main differences between teff and bran? Bran has less manganese, iron, copper, phosphorus, vitamin B6, magnesium, zinc, fiber, vitamin B3, and vitamin B1 than teff. Teff's daily need coverage for manganese is 360% higher. Teff has 23 times more vitamin B3 than bran. Teff has 3.363mg of vitamin B3, while bran has 0.144mg. We used Teff, uncooked and Oat bran, cooked types in this comparison.
Infographic
Mineral Comparison
Mineral comparison score is based on the number of minerals by which one or the other food is richer. The "coverage" charts below show how much of the daily needs can be covered by 300 grams of the food.
8
100 g
300 g
1 cup - 193g
Magnesium
Magnesium
Calcium
Calcium
Potassium
Potassium
Iron
Iron
Copper
Copper
Zinc
Zinc
Phosphorus
Phosphorus
Sodium
Sodium
Manganese
Manganese
Selenium
Selenium
131%
54%
38%
286%
270%
99%
184%
1.6%
1205%
24%
2
100 g
300 g
1 cup - 219g
Magnesium
Magnesium
Calcium
Calcium
Potassium
Potassium
Iron
Iron
Copper
Copper
Zinc
Zinc
Phosphorus
Phosphorus
Sodium
Sodium
Manganese
Manganese
Selenium
Selenium
29%
3%
8.1%
33%
22%
14%
51%
0.13%
126%
42%
Vitamin Comparison
Vitamin comparison score is based on the number of vitamins by which one or the other food is richer. The "coverage" charts below show how much of the daily needs can be covered by 300 grams of the food.
7
100 g
300 g
1 cup - 193g
Vitamin C
Vit. C
Vitamin D
Vit. D
Vitamin A
Vit. A
Vitamin E
Vit. E
Vitamin B1
Vit. B1
Vitamin B2
Vit. B2
Vitamin B3
Vit. B3
Vitamin B5
Vit. B5
Vitamin B6
Vit. B6
Vitamin B12
Vit. B12
Vitamin K
Vit. K
Folate
Folate
0%
0%
0%
1.6%
98%
62%
63%
57%
111%
0%
4.8%
0%
1
100 g
300 g
1 cup - 219g
Vitamin C
Vit. C
Vitamin D
Vit. D
Vitamin A
Vit. A
Vitamin E
Vit. E
Vitamin B1
Vit. B1
Vitamin B2
Vit. B2
Vitamin B3
Vit. B3
Vitamin B5
Vit. B5
Vitamin B6
Vit. B6
Vitamin B12
Vit. B12
Vitamin K
Vit. K
Folate
Folate
0%
0%
0%
0%
40%
7.8%
2.7%
13%
5.8%
0%
0%
4.5%
All nutrients comparison - raw data values
Nutrient
DV% diff.
Manganese
9.24mg
0.964mg
360%
Iron
7.63mg
0.88mg
84%
Copper
0.81mg
0.066mg
83%
Phosphorus
429mg
119mg
44%
Vitamin B6
0.482mg
0.025mg
35%
Magnesium
184mg
40mg
34%
Zinc
3.63mg
0.53mg
28%
Fiber
8g
2.6g
22%
Carbs
73.13g
11.44g
21%
Protein
13.3g
3.21g
20%
Vitamin B3
3.363mg
0.144mg
20%
Vitamin B1
0.39mg
0.16mg
19%
Vitamin B2
0.27mg
0.034mg
18%
Calcium
180mg
10mg
17%
Calories
367kcal
40kcal
16%
Starch
36.56g
15%
Vitamin B5
0.942mg
0.217mg
15%
Potassium
427mg
92mg
10%
Selenium
4.4µg
7.7µg
6%
Polyunsaturated fat
1.071g
0.339g
5%
Fats
2.38g
0.86g
2%
Vitamin K
1.9µg
2%
Folate
6µg
2%
Choline
13.1mg
2%
Vitamin E
0.08mg
1%
Saturated fat
0.449g
0.163g
1%
Monounsaturated fat
0.589g
0.291g
1%
Fructose
0.47g
1%
Protein per 100 calories
3.6g
8g
N/A
Calories per 10 g protein
276kcal
125kcal
N/A
Weight per 100 calories
27g
250g
N/A
Unsaturated / Saturated Fat ratio
3.7
3.9
N/A
Net carbs
65.13g
8.84g
N/A
Sugar
1.84g
N/A
Sodium
12mg
1mg
0%
Tryptophan
0.139mg
0.057mg
0%
Threonine
0.51mg
0.086mg
0%
Isoleucine
0.501mg
0.114mg
0%
Leucine
1.068mg
0.235mg
0%
Lysine
0.376mg
0.13mg
0%
Methionine
0.428mg
0.057mg
0%
Phenylalanine
0.698mg
0.155mg
0%
Valine
0.686mg
0.165mg
0%
Histidine
0.301mg
0.07mg
0%
Omega-3 - ALA
0.135g
N/A
Macronutrient Comparison
Macronutrient breakdown side-by-side comparison
4
13%
2%
73%
9%
2%
Protein:
13.3 g
Fats:
2.38 g
Carbs:
73.13 g
Water:
8.82 g
Other:
2.37 g
1
3%
11%
84%
Protein:
3.21 g
Fats:
0.86 g
Carbs:
11.44 g
Water:
84 g
Other:
0.49 g
Contains
more
Protein Protein
+314.3%
Contains
more
Fats Fats
+176.7%
Contains
more
Carbs Carbs
+539.2%
Contains
more
Other Other
+383.7%
Contains
more
Water Water
+852.4%
Fat Type Comparison
Fat type breakdown side-by-side comparison
2
21%
28%
51%
Saturated fat:
Sat. Fat
0.449 g
Monounsaturated fat:
Mono. Fat
0.589 g
Polyunsaturated fat:
Poly. Fat
1.071 g
1
21%
37%
43%
Saturated fat:
Sat. Fat
0.163 g
Monounsaturated fat:
Mono. Fat
0.291 g
Polyunsaturated fat:
Poly. Fat
0.339 g
Contains
more
Mono. Fat Monounsaturated fat
+102.4%
Contains
more
Poly. Fat Polyunsaturated fat
+215.9%
Contains
less
Sat. Fat Saturated fat
-63.7%