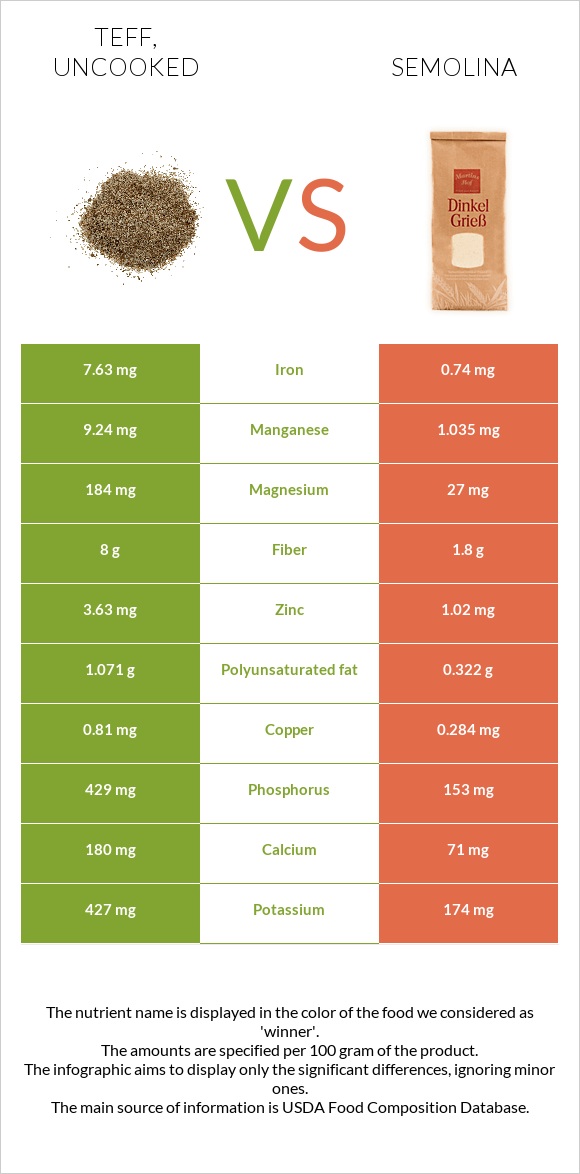
How are teff and semolina different? Teff is richer in manganese, iron, copper, phosphorus, magnesium, fiber, zinc, vitamin B2, and vitamin B1, while semolina is higher in selenium. Teff covers your daily need for manganese, 357% more than semolina. Teff contains 10 times more iron than semolina. Teff contains 7.63mg of iron, while semolina contains 0.74mg. Teff, uncooked and Rice, white, long-grain, parboiled, unenriched, dry types were used in this article.
Infographic
Mineral Comparison
Mineral comparison score is based on the number of minerals by which one or the other food is richer. The "coverage" charts below show how much of the daily needs can be covered by 300 grams of the food.
8
100 g
300 g
1 cup - 193g
Magnesium
Magnesium
Calcium
Calcium
Potassium
Potassium
Iron
Iron
Copper
Copper
Zinc
Zinc
Phosphorus
Phosphorus
Sodium
Sodium
Manganese
Manganese
Selenium
Selenium
131%
54%
38%
286%
270%
99%
184%
1.6%
1205%
24%
2
100 g
300 g
1 cup - 185g
Magnesium
Magnesium
Calcium
Calcium
Potassium
Potassium
Iron
Iron
Copper
Copper
Zinc
Zinc
Phosphorus
Phosphorus
Sodium
Sodium
Manganese
Manganese
Selenium
Selenium
19%
21%
15%
28%
95%
28%
66%
0.26%
135%
109%
Vitamin Comparison
Vitamin comparison score is based on the number of vitamins by which one or the other food is richer. The "coverage" charts below show how much of the daily needs can be covered by 300 grams of the food.
5
100 g
300 g
1 cup - 193g
Vitamin C
Vit. C
Vitamin D
Vit. D
Vitamin A
Vit. A
Vitamin E
Vit. E
Vitamin B1
Vit. B1
Vitamin B2
Vit. B2
Vitamin B3
Vit. B3
Vitamin B5
Vit. B5
Vitamin B6
Vit. B6
Vitamin B12
Vit. B12
Vitamin K
Vit. K
Folate
Folate
0%
0%
0%
1.6%
98%
62%
63%
57%
111%
0%
4.8%
0%
2
100 g
300 g
1 cup - 185g
Vitamin C
Vit. C
Vitamin D
Vit. D
Vitamin A
Vit. A
Vitamin E
Vit. E
Vitamin B1
Vit. B1
Vitamin B2
Vit. B2
Vitamin B3
Vit. B3
Vitamin B5
Vit. B5
Vitamin B6
Vit. B6
Vitamin B12
Vit. B12
Vitamin K
Vit. K
Folate
Folate
0%
0%
0%
0.6%
56%
12%
95%
40%
104%
0%
0.25%
6%
All nutrients comparison - raw data values
Nutrient
DV% diff.
Manganese
9.24mg
1.035mg
357%
Iron
7.63mg
0.74mg
86%
Copper
0.81mg
0.284mg
58%
Phosphorus
429mg
153mg
39%
Magnesium
184mg
27mg
37%
Selenium
4.4µg
19.9µg
28%
Fiber
8g
1.8g
25%
Zinc
3.63mg
1.02mg
24%
Vitamin B2
0.27mg
0.05mg
17%
Vitamin B1
0.39mg
0.224mg
14%
Starch
36.56g
68.29g
13%
Protein
13.3g
7.51g
12%
Calcium
180mg
71mg
11%
Vitamin B3
3.363mg
5.048mg
11%
Potassium
427mg
174mg
7%
Vitamin B5
0.942mg
0.672mg
5%
Polyunsaturated fat
1.071g
0.322g
5%
Carbs
73.13g
80.89g
3%
Fats
2.38g
1.03g
2%
Vitamin B6
0.482mg
0.452mg
2%
Vitamin K
1.9µg
0.1µg
2%
Folate
8µg
2%
Choline
13.1mg
2%
Saturated fat
0.449g
0.294g
1%
Monounsaturated fat
0.589g
0.258g
1%
Fructose
0.47g
0.02g
1%
Calories
367kcal
374kcal
0%
Protein per 100 calories
3.6g
2g
N/A
Calories per 10 g protein
276kcal
498kcal
N/A
Weight per 100 calories
27g
27g
N/A
Unsaturated / Saturated Fat ratio
3.7
2
N/A
Net carbs
65.13g
79.09g
N/A
Sugar
1.84g
0.33g
N/A
Sodium
12mg
2mg
0%
Vitamin E
0.08mg
0.03mg
0%
Tryptophan
0.139mg
0.103mg
0%
Threonine
0.51mg
0.271mg
0%
Isoleucine
0.501mg
0.339mg
0%
Leucine
1.068mg
0.656mg
0%
Lysine
0.376mg
0.215mg
0%
Methionine
0.428mg
0.183mg
0%
Phenylalanine
0.698mg
0.398mg
0%
Valine
0.686mg
0.47mg
0%
Histidine
0.301mg
0.185mg
0%
Omega-3 - ALA
0.135g
N/A
Macronutrient Comparison
Macronutrient breakdown side-by-side comparison
3
13%
2%
73%
9%
2%
Protein:
13.3 g
Fats:
2.38 g
Carbs:
73.13 g
Water:
8.82 g
Other:
2.37 g
2
8%
81%
10%
Protein:
7.51 g
Fats:
1.03 g
Carbs:
80.89 g
Water:
9.86 g
Other:
0.71 g
Contains
more
Protein Protein
+77.1%
Contains
more
Fats Fats
+131.1%
Contains
more
Other Other
+233.8%
Contains
more
Carbs Carbs
+10.6%
Contains
more
Water Water
+11.8%
Fat Type Comparison
Fat type breakdown side-by-side comparison
2
21%
28%
51%
Saturated fat:
Sat. Fat
0.449 g
Monounsaturated fat:
Mono. Fat
0.589 g
Polyunsaturated fat:
Poly. Fat
1.071 g
1
34%
30%
37%
Saturated fat:
Sat. Fat
0.294 g
Monounsaturated fat:
Mono. Fat
0.258 g
Polyunsaturated fat:
Poly. Fat
0.322 g
Contains
more
Mono. Fat Monounsaturated fat
+128.3%
Contains
more
Poly. Fat Polyunsaturated fat
+232.6%
Contains
less
Sat. Fat Saturated fat
-34.5%
Carbohydrate type comparison
Carbohydrate type breakdown side-by-side comparison
4
95%
2%
Starch:
36.56 g
Sucrose:
0.62 g
Glucose:
0.73 g
Fructose:
0.47 g
Lactose:
0 g
Maltose:
0.01 g
Galactose:
0 g
1
100%
Starch:
68.29 g
Sucrose:
0.21 g
Glucose:
0.11 g
Fructose:
0.02 g
Lactose:
0 g
Maltose:
0 g
Galactose:
0 g
Contains
more
Sucrose Sucrose
+195.2%
Contains
more
Glucose Glucose
+563.6%
Contains
more
Fructose Fructose
+2250%
Contains
more
Maltose Maltose
+∞%
Contains
more
Starch Starch
+86.8%
~equal in
Lactose
~0g
~equal in
Galactose
~0g