Teff vs. Millet — Health Impact and Nutrition Comparison


Summary
Teff contains more manganese, iron, copper, phosphorus, zinc, calcium, magnesium, and Vitamin B1 than millet. It is also lower in saturated fat, sugar, and glycemic index.
Millet is richer in Vitamin B2, B3, B6, and A and has less sodium than teff.
Introduction
In this article, you can find a detailed description of the differences between millet and teff.
What's The Actual Difference?
Teff is just one of the wide millet varieties classified as small millet. However, scientifically, it only belongs to the same subfamily and tribe. Millet has a mild corn-like flavor that is slightly sweeter than other grains, while teff has the mildest flavor and darker varieties have an earthier taste. Teff resembles tiny flax or brown poppy seeds, while millet resembles tiny corn kernels or seeds.
Nutrition
In this section, we will look into the differences between the nutrients of millet and teff. Below, you can find the nutrition infographics that visually show the differences between them․
Calories
Teff contains 101 calories per 100g, and millet contains 119 calories per 100g.
Fats
Both have tiny amounts of fats.
Carbs
Teff contains 19.86g of carbs per 100g, whereas millet contains 23.67g of carbs per 100g.
Fiber
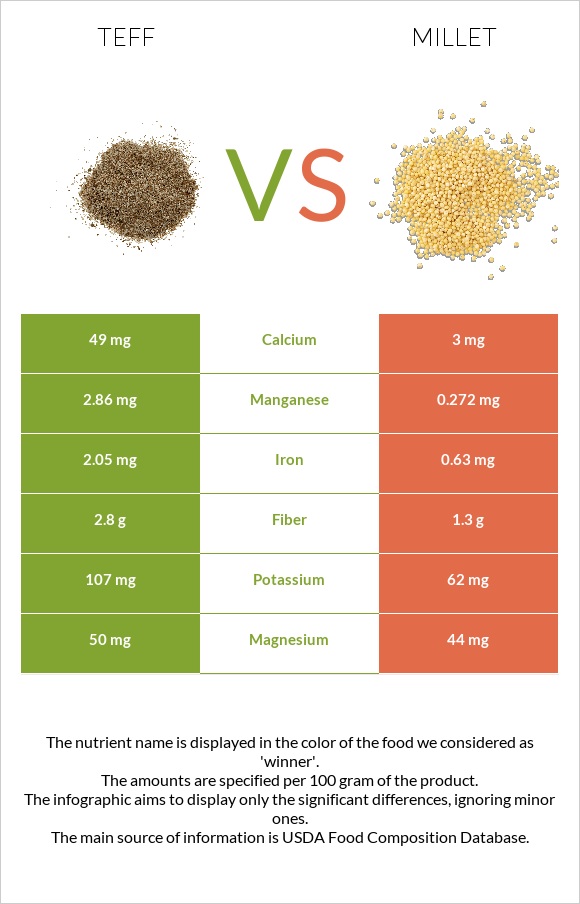
The amount of fiber in teff is higher than that of millet. Teff has 2.8g per 100g, while millet contains only 1.3g fiber.
Vitamins
The vitamin content of millet is richer than that of teff.
Millet contains more Vitamin A, Vitamin B2, Vitamin B3, and Vitamin B6.
On the other hand, teff contains more Vitamin B1.
Both have equal amounts of folate.
Vitamin Comparison
Contains
more
Vitamin B1Vitamin B1
+72.6%
Contains
more
Vitamin B2Vitamin B2
+148.5%
Contains
more
Vitamin B3Vitamin B3
+46.3%
Contains
more
Vitamin B6Vitamin B6
+11.3%
Minerals
Teff contains more calcium, iron, copper, magnesium, phosphorus, potassium, and zinc than millet.
In addition, teff falls in the range of the top 8% of foods as a source of iron.
Millet has less sodium.
Mineral Comparison
Contains
more
MagnesiumMagnesium
+13.6%
Contains
more
CalciumCalcium
+1533.3%
Contains
more
PotassiumPotassium
+72.6%
Contains
more
IronIron
+225.4%
Contains
more
CopperCopper
+40.4%
Contains
more
ZincZinc
+22%
Contains
more
PhosphorusPhosphorus
+20%
Contains
more
ManganeseManganese
+951.5%
Contains
less
SodiumSodium
-75%
Glycemic Index
Teff is considered moderate glycemic index food, and millet is considered high glycemic index food. The GI of teff is 57, whereas the GI of millet equals 71.
Health Impact
Teff contains more iron than millet, which benefits the overall blood and circulation system. It prevents the development of iron deficiency anemia. This was most noticeable in pregnant women (1).
Teff is also higher in zinc, which has several health benefits and regulates overall homeostasis. Zinc boosts the immune system, reduces the onset of chronic diseases, and lowers the risk of diabetes and cancer (2).
Gluten-Free
Gluten is a protein group found in wheat and other grains that gives dough its elasticity. Some people cannot consume gluten due to celiac disease, an autoimmune condition. Celiac disease is characterized by your immune system attacking the lining of your small intestine. This can cause anemia, weight loss, diarrhea, constipation, fatigue, and bloating by impairing nutrient absorption. Teff and millet are gluten-free alternatives to wheat flour (3).
Diabetes
Both millet and teff are high in fiber and non-starchy polysaccharides, two types of indigestible carbohydrates that aid in blood sugar control (4). As a result, millet and teff are regarded as the ideal grain for people with diabetes. For example, a study (5) of 105 people with type 2 diabetes discovered that switching from a rice-based breakfast to a millet-based breakfast reduced blood sugar levels after the meal.
Cardiovascular Health
Research suggests that consuming both teff and millet may lead to improvements in lipid profiles by reducing LDL ("bad" cholesterol) levels in the blood. This reduction is significant because high LDL is a primary cause of atherosclerotic plaque formation (6,7).
Additionally, a study on rats indicates that millet contains certain proteins that may inhibit the activity of the ACE enzyme and lower levels of angiotensin II. This mechanism is similar to that of some antihypertensive medications, such as Captopril, Lisinopril, Valsartan, and Losartan. There is currently no similar information available for teff (8).
The American Heart Association (AHA) recommends the inclusion of whole grains as part of a heart-healthy diet. Both teff and millet qualify as whole grains and can provide cardiovascular benefits (9).
Similarly, the European Society of Cardiology (ESC) advocates for whole grain consumption due to its protective effects against cardiovascular disease. Incorporating grains like teff and millet can be an important aspect of a heart-healthy dietary plan (10).
References
- https://pubmed.ncbi.nlm.nih.gov/29936535/
- https://pubmed.ncbi.nlm.nih.gov/22071549
- https://pubmed.ncbi.nlm.nih.gov/26396284/
- https://pubmed.ncbi.nlm.nih.gov/29803440/
- https://pubmed.ncbi.nlm.nih.gov/28361824/
- https://pubmed.ncbi.nlm.nih.gov/35813674/
- https://www.researchgate.net/publication/251400319_Antioxidant_Phenolics_of_Millet_Control_Lipid_Peroxidation_in_Human_LDL_Cholesterol_and_Food_Systems
- https://pubmed.ncbi.nlm.nih.gov/27344669/
- https://www.ahajournals.org/doi/10.1161/circulationaha.115.021101
- https://www.escardio.org/Education/ESC-Prevention-of-CVD-Programme/Treatment-goals/Risk-factor-control/nutrition

Infographic
All nutrients comparison - raw data values
| Nutrient | |
|
DV% diff. |
| Manganese | 2.86mg | 0.272mg | 113% |
| Iron | 2.05mg | 0.63mg | 18% |
| Copper | 0.226mg | 0.161mg | 7% |
| Fiber | 2.8g | 1.3g | 6% |
| Vitamin B1 | 0.183mg | 0.106mg | 6% |
| Calcium | 49mg | 3mg | 5% |
| Vitamin B2 | 0.033mg | 0.082mg | 4% |
| Phosphorus | 120mg | 100mg | 3% |
| Vitamin B3 | 0.909mg | 1.33mg | 3% |
| Vitamin B5 | 0.171mg | 3% | |
| Polyunsaturated fat | 0.508g | 3% | |
| Zinc | 1.11mg | 0.91mg | 2% |
| Selenium | 0.9µg | 2% | |
| Choline | 11.2mg | 2% | |
| Calories | 101kcal | 119kcal | 1% |
| Protein | 3.87g | 3.51g | 1% |
| Fats | 0.65g | 1g | 1% |
| Carbs | 19.86g | 23.67g | 1% |
| Magnesium | 50mg | 44mg | 1% |
| Potassium | 107mg | 62mg | 1% |
| Vitamin B6 | 0.097mg | 0.108mg | 1% |
| Saturated fat | 0.172g | 1% | |
| Protein per 100 calories | 3.8g | 2.9g | N/A |
| Calories per 10 g protein | 261kcal | 339kcal | N/A |
| Weight per 100 calories | 99g | 84g | N/A |
| Net carbs | 17.06g | 22.37g | N/A |
| Sugar | 0.13g | N/A | |
| Sodium | 8mg | 2mg | 0% |
| Vitamin E | 0.02mg | 0% | |
| Vitamin K | 0.3µg | 0% | |
| Folate | 18µg | 19µg | 0% |
| Monounsaturated fat | 0.184g | 0% | |
| Tryptophan | 0.041mg | 0.038mg | 0% |
| Threonine | 0.149mg | 0.113mg | 0% |
| Isoleucine | 0.146mg | 0.148mg | 0% |
| Leucine | 0.311mg | 0.446mg | 0% |
| Lysine | 0.109mg | 0.067mg | 0% |
| Methionine | 0.125mg | 0.07mg | 0% |
| Phenylalanine | 0.203mg | 0.185mg | 0% |
| Valine | 0.2mg | 0.184mg | 0% |
| Histidine | 0.088mg | 0.075mg | 0% |
Macronutrient Comparison
| Contains more OtherOther | +68.3% |
| Contains more FatsFats | +53.8% |
| Contains more CarbsCarbs | +19.2% |
People also compare


References
All the values for which the sources are not specified explicitly are taken from FDA’s Food Central. The exact link to the food presented on this page can be found below.
- Teff - https://fdc.nal.usda.gov/fdc-app.html#/food-details/168918/nutrients
- Millet - https://fdc.nal.usda.gov/fdc-app.html#/food-details/168871/nutrients
All the Daily Values are presented for males aged 31-50, for 2000-calorie diets.