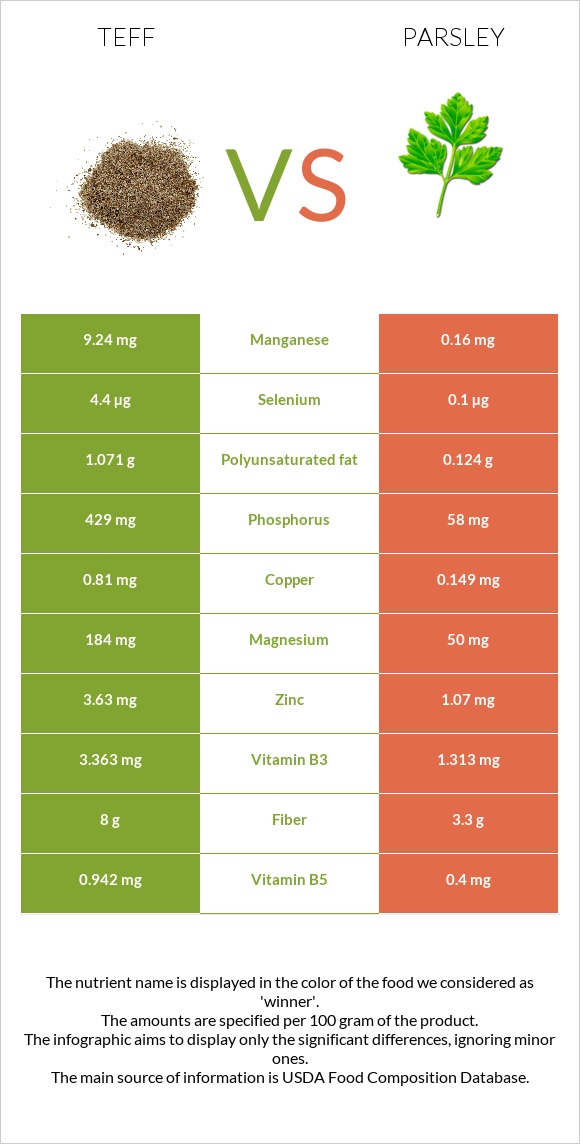
Significant differences between teff and parsley Teff has more manganese, phosphorus, copper, and vitamin B1; however, parsley is richer in vitamin A, iron, folate, potassium, and calcium. Parsley covers your daily vitamin A needs 168% more than teff. Parsley has 18 times less manganese than teff. Teff has 2.86mg of manganese, while parsley has 0.16mg. Teff has a higher glycemic index. The glycemic index of teff is 57, while the glycemic index of parsley is 32. Specific food types used in this comparison are Teff, cooked and Parsley, fresh .
Infographic
Mineral Comparison
Mineral comparison score is based on the number of minerals by which one or the other food is richer. The "coverage" charts below show how much of the daily needs can be covered by 300 grams of the food.
4
100 g
300 g
1 cup - 252g
Magnesium
Magnesium
Calcium
Calcium
Potassium
Potassium
Iron
Iron
Copper
Copper
Zinc
Zinc
Phosphorus
Phosphorus
Sodium
Sodium
Manganese
Manganese
Selenium
Selenium
36%
15%
9.4%
77%
75%
30%
51%
1%
373%
0%
4
100 g
300 g
1 tbsp - 3.8g 10 sprigs - 10g 1 cup chopped - 60g
Magnesium
Magnesium
Calcium
Calcium
Potassium
Potassium
Iron
Iron
Copper
Copper
Zinc
Zinc
Phosphorus
Phosphorus
Sodium
Sodium
Manganese
Manganese
Selenium
Selenium
36%
41%
49%
233%
50%
29%
25%
7.3%
21%
0.55%
Vitamin Comparison
Vitamin comparison score is based on the number of vitamins by which one or the other food is richer. The "coverage" charts below show how much of the daily needs can be covered by 300 grams of the food.
1
100 g
300 g
1 cup - 252g
Vitamin C
Vit. C
Vitamin D
Vit. D
Vitamin A
Vit. A
Vitamin E
Vit. E
Vitamin B1
Vit. B1
Vitamin B2
Vit. B2
Vitamin B3
Vit. B3
Vitamin B5
Vit. B5
Vitamin B6
Vit. B6
Vitamin B12
Vit. B12
Vitamin K
Vit. K
Folate
Folate
0%
0%
0%
0%
46%
7.6%
17%
0%
22%
0%
0%
14%
8
100 g
300 g
1 tbsp - 3.8g 10 sprigs - 10g 1 cup chopped - 60g
Vitamin C
Vit. C
Vitamin D
Vit. D
Vitamin A
Vit. A
Vitamin E
Vit. E
Vitamin B1
Vit. B1
Vitamin B2
Vit. B2
Vitamin B3
Vit. B3
Vitamin B5
Vit. B5
Vitamin B6
Vit. B6
Vitamin B12
Vit. B12
Vitamin K
Vit. K
Folate
Folate
443%
0%
140%
15%
22%
23%
25%
24%
21%
0%
4100%
114%
All nutrients comparison - raw data values
Nutrient
DV% diff.
Vitamin K
1640µg
1367%
Vitamin C
133mg
148%
Manganese
2.86mg
0.16mg
117%
Iron
2.05mg
6.2mg
52%
Vitamin A
0µg
421µg
47%
Folate
18µg
152µg
34%
Potassium
107mg
554mg
13%
Calcium
49mg
138mg
9%
Copper
0.226mg
0.149mg
9%
Phosphorus
120mg
58mg
9%
Vitamin B1
0.183mg
0.086mg
8%
Vitamin B5
0.4mg
8%
Carbs
19.86g
6.33g
5%
Vitamin E
0.75mg
5%
Vitamin B2
0.033mg
0.098mg
5%
Calories
101kcal
36kcal
3%
Vitamin B3
0.909mg
1.313mg
3%
Protein
3.87g
2.97g
2%
Fiber
2.8g
3.3g
2%
Sodium
8mg
56mg
2%
Choline
12.8mg
2%
Vitamin B6
0.097mg
0.09mg
1%
Saturated fat
0.132g
1%
Monounsaturated fat
0.295g
1%
Polyunsaturated fat
0.124g
1%
Protein per 100 calories
3.8g
8.3g
N/A
Calories per 10 g protein
261kcal
121kcal
N/A
Weight per 100 calories
99g
278g
N/A
Fats
0.65g
0.79g
0%
Net carbs
17.06g
3.03g
N/A
Magnesium
50mg
50mg
0%
Sugar
0.85g
N/A
Zinc
1.11mg
1.07mg
0%
Selenium
0.1µg
0%
Tryptophan
0.041mg
0.045mg
0%
Threonine
0.149mg
0.122mg
0%
Isoleucine
0.146mg
0.118mg
0%
Leucine
0.311mg
0.204mg
0%
Lysine
0.109mg
0.181mg
0%
Methionine
0.125mg
0.042mg
0%
Phenylalanine
0.203mg
0.145mg
0%
Valine
0.2mg
0.172mg
0%
Histidine
0.088mg
0.061mg
0%
Macronutrient Comparison
Macronutrient breakdown side-by-side comparison
2
4%
20%
75%
Protein:
3.87 g
Fats:
0.65 g
Carbs:
19.86 g
Water:
74.93 g
Other:
0.69 g
3
3%
6%
88%
2%
Protein:
2.97 g
Fats:
0.79 g
Carbs:
6.33 g
Water:
87.71 g
Other:
2.2 g
Contains
more
Protein Protein
+30.3%
Contains
more
Carbs Carbs
+213.7%
Contains
more
Fats Fats
+21.5%
Contains
more
Water Water
+17.1%
Contains
more
Other Other
+218.8%