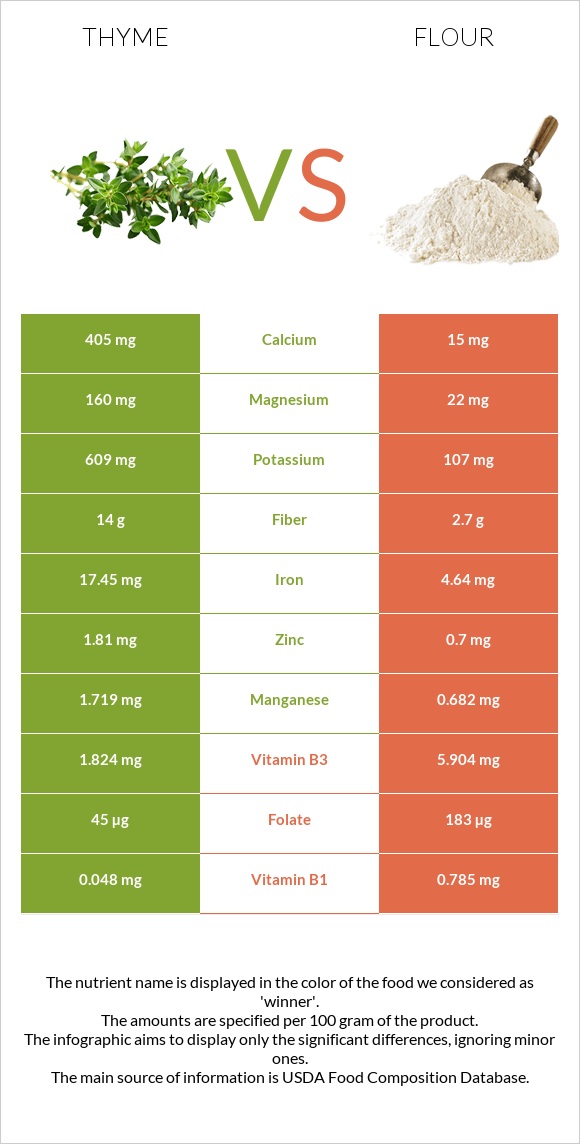
Significant differences between thyme and flour Thyme has more vitamin C, iron, vitamin A, copper, fiber, manganese, calcium, and magnesium; however, flour is richer in vitamin B1 and folate. Thyme covers your daily vitamin C needs 178% more than flour. Flour has a higher glycemic index. The glycemic index of flour is 72, while the glycemic index of thyme is 45. Specific food types used in this comparison are Thyme, fresh and Wheat flour, white, all-purpose, enriched, bleached .
Infographic
Mineral Comparison
Mineral comparison score is based on the number of minerals by which one or the other food is richer. The "coverage" charts below show how much of the daily needs can be covered by 300 grams of the food.
7
100 g
300 g
0.5 tsp - 0.4g 1 tsp - 0.8g
Magnesium
Magnesium
Calcium
Calcium
Potassium
Potassium
Iron
Iron
Copper
Copper
Zinc
Zinc
Phosphorus
Phosphorus
Sodium
Sodium
Manganese
Manganese
Selenium
Selenium
114%
122%
54%
654%
185%
49%
45%
1.2%
224%
0%
2
100 g
300 g
1 cup - 125g
Magnesium
Magnesium
Calcium
Calcium
Potassium
Potassium
Iron
Iron
Copper
Copper
Zinc
Zinc
Phosphorus
Phosphorus
Sodium
Sodium
Manganese
Manganese
Selenium
Selenium
16%
4.5%
9.4%
174%
48%
19%
46%
0.26%
89%
185%
Vitamin Comparison
Vitamin comparison score is based on the number of vitamins by which one or the other food is richer. The "coverage" charts below show how much of the daily needs can be covered by 300 grams of the food.
3
100 g
300 g
0.5 tsp - 0.4g 1 tsp - 0.8g
Vitamin C
Vit. C
Vitamin D
Vit. D
Vitamin A
Vit. A
Vitamin E
Vit. E
Vitamin B1
Vit. B1
Vitamin B2
Vit. B2
Vitamin B3
Vit. B3
Vitamin B5
Vit. B5
Vitamin B6
Vit. B6
Vitamin B12
Vit. B12
Vitamin K
Vit. K
Folate
Folate
534%
0%
79%
0%
12%
109%
34%
25%
80%
0%
0%
34%
5
100 g
300 g
1 cup - 125g
Vitamin C
Vit. C
Vitamin D
Vit. D
Vitamin A
Vit. A
Vitamin E
Vit. E
Vitamin B1
Vit. B1
Vitamin B2
Vit. B2
Vitamin B3
Vit. B3
Vitamin B5
Vit. B5
Vitamin B6
Vit. B6
Vitamin B12
Vit. B12
Vitamin K
Vit. K
Folate
Folate
0%
0%
0%
1.2%
196%
114%
111%
26%
10%
0%
0.75%
137%
All nutrients comparison - raw data values
Nutrient
DV% diff.
Vitamin C
160.1mg
0mg
178%
Iron
17.45mg
4.64mg
160%
Selenium
33.9µg
62%
Vitamin B1
0.048mg
0.785mg
61%
Copper
0.555mg
0.144mg
46%
Fiber
14g
2.7g
45%
Manganese
1.719mg
0.682mg
45%
Calcium
405mg
15mg
39%
Folate
45µg
183µg
35%
Magnesium
160mg
22mg
33%
Vitamin A
238µg
0µg
26%
Vitamin B3
1.824mg
5.904mg
26%
Vitamin B6
0.348mg
0.044mg
23%
Carbs
24.45g
76.31g
17%
Potassium
609mg
107mg
15%
Calories
101kcal
364kcal
13%
Protein
5.56g
10.33g
10%
Zinc
1.81mg
0.7mg
10%
Vitamin B2
0.471mg
0.494mg
2%
Choline
10.4mg
2%
Fats
1.68g
0.98g
1%
Vitamin B5
0.409mg
0.438mg
1%
Saturated fat
0.467g
0.155g
1%
Polyunsaturated fat
0.532g
0.413g
1%
Protein per 100 calories
5.5g
2.8g
N/A
Calories per 10 g protein
182kcal
352kcal
N/A
Weight per 100 calories
99g
27g
N/A
Net carbs
10.45g
73.61g
N/A
Sugar
0.27g
N/A
Phosphorus
106mg
108mg
0%
Sodium
9mg
2mg
0%
Vitamin E
0.06mg
0%
Vitamin K
0.3µg
0%
Monounsaturated fat
0.081g
0.087g
0%
Tryptophan
0.114mg
0.127mg
0%
Threonine
0.154mg
0.281mg
0%
Isoleucine
0.285mg
0.357mg
0%
Leucine
0.262mg
0.71mg
0%
Lysine
0.126mg
0.228mg
0%
Methionine
0.183mg
0%
Phenylalanine
0.52mg
0%
Valine
0.307mg
0.415mg
0%
Histidine
0.23mg
0%
Macronutrient Comparison
Macronutrient breakdown side-by-side comparison
3
6%
2%
24%
65%
3%
Protein:
5.56 g
Fats:
1.68 g
Carbs:
24.45 g
Water:
65.11 g
Other:
3.2 g
2
10%
76%
12%
Protein:
10.33 g
Fats:
0.98 g
Carbs:
76.31 g
Water:
11.92 g
Other:
0.46 g
Contains
more
Fats Fats
+71.4%
Contains
more
Water Water
+446.2%
Contains
more
Other Other
+595.7%
Contains
more
Protein Protein
+85.8%
Contains
more
Carbs Carbs
+212.1%
Fat Type Comparison
Fat type breakdown side-by-side comparison
1
43%
8%
49%
Saturated fat:
Sat. Fat
0.467 g
Monounsaturated fat:
Mono. Fat
0.081 g
Polyunsaturated fat:
Poly. Fat
0.532 g
2
24%
13%
63%
Saturated fat:
Sat. Fat
0.155 g
Monounsaturated fat:
Mono. Fat
0.087 g
Polyunsaturated fat:
Poly. Fat
0.413 g
Contains
more
Poly. Fat Polyunsaturated fat
+28.8%
Contains
less
Sat. Fat Saturated fat
-66.8%
~equal in
Monounsaturated fat
~0.087g