What are the main differences between tofu and roquefort? Tofu is richer in iron and manganese, while roquefort is higher in phosphorus, vitamin B2, vitamin B5, calcium, and vitamin B12. Roquefort's daily need coverage for saturated fat is 93% higher. Roquefort has 20 times less manganese than tofu. Tofu has 0.605mg of manganese, while roquefort has 0.03mg. Tofu is lower in saturated fat. Roquefort has a higher glycemic index (27) than tofu (15). We used Tofu, raw, regular, prepared with calcium sulfate and Cheese, roquefort types in this comparison.
Infographic
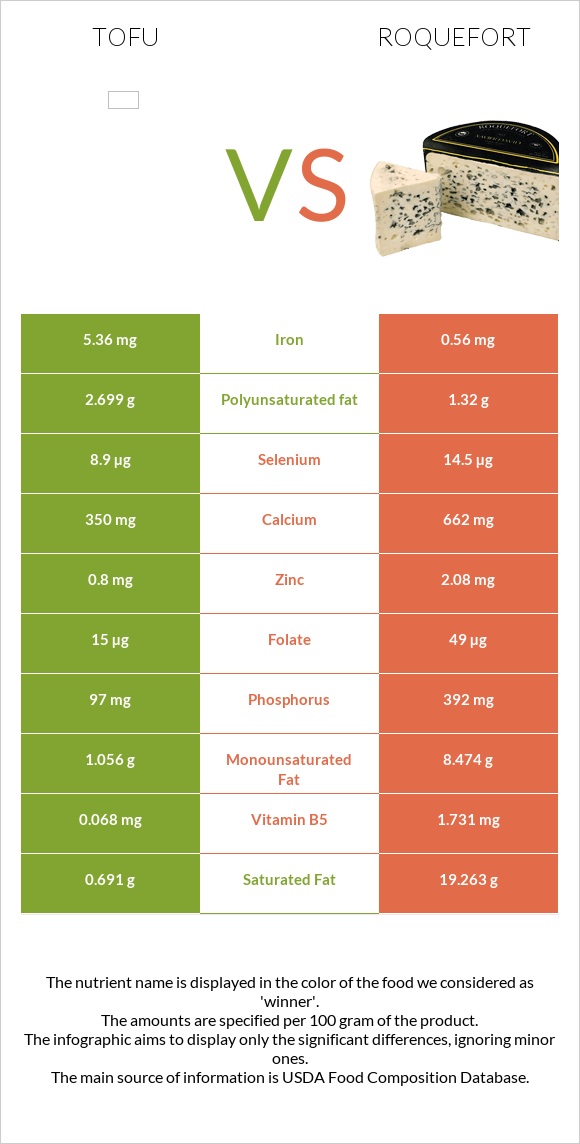
Mineral Comparison
Mineral comparison score is based on the number of minerals by which one or the other food is richer. The "coverage" charts below show how much of the daily needs can be covered by 300 grams of the food.
5
100 g
300 g
0.25 block - 116g 0.5 cup - 124g
Magnesium
Magnesium
Calcium
Calcium
Potassium
Potassium
Iron
Iron
Copper
Copper
Zinc
Zinc
Phosphorus
Phosphorus
Sodium
Sodium
Manganese
Manganese
Selenium
Selenium
21%
105%
11%
201%
64%
22%
42%
0.91%
79%
49%
4
100 g
300 g
1 oz - 28.35g 1 package (3 oz) - 85g
Magnesium
Magnesium
Calcium
Calcium
Potassium
Potassium
Iron
Iron
Copper
Copper
Zinc
Zinc
Phosphorus
Phosphorus
Sodium
Sodium
Manganese
Manganese
Selenium
Selenium
21%
199%
8%
21%
11%
57%
168%
236%
3.9%
79%
Vitamin Comparison
Vitamin comparison score is based on the number of vitamins by which one or the other food is richer. The "coverage" charts below show how much of the daily needs can be covered by 300 grams of the food.
4
100 g
300 g
0.25 block - 116g 0.5 cup - 124g
Vitamin C
Vit. C
Vitamin D
Vit. D
Vitamin A
Vit. A
Vitamin E
Vit. E
Vitamin B1
Vit. B1
Vitamin B2
Vit. B2
Vitamin B3
Vit. B3
Vitamin B5
Vit. B5
Vitamin B6
Vit. B6
Vitamin B12
Vit. B12
Vitamin K
Vit. K
Folate
Folate
0.33%
0%
0%
0.2%
20%
12%
3.7%
4.1%
11%
0%
6%
11%
7
100 g
300 g
1 oz - 28.35g 1 package (3 oz) - 85g
Vitamin C
Vit. C
Vitamin D
Vit. D
Vitamin A
Vit. A
Vitamin E
Vit. E
Vitamin B1
Vit. B1
Vitamin B2
Vit. B2
Vitamin B3
Vit. B3
Vitamin B5
Vit. B5
Vitamin B6
Vit. B6
Vitamin B12
Vit. B12
Vitamin K
Vit. K
Folate
Folate
0%
0%
98%
0%
10%
135%
14%
104%
29%
80%
0%
37%
All nutrients comparison - raw data values
Nutrient
DV% diff.
Saturated fat
0.691g
19.263g
84%
Sodium
7mg
1809mg
78%
Iron
5.36mg
0.56mg
60%
Phosphorus
97mg
392mg
42%
Vitamin B2
0.052mg
0.586mg
41%
Fats
4.78g
30.64g
40%
Vitamin A
294µg
33%
Vitamin B5
0.068mg
1.731mg
33%
Calcium
350mg
662mg
31%
Cholesterol
0mg
90mg
30%
Protein
8.08g
21.54g
27%
Vitamin B12
0µg
0.64µg
27%
Manganese
0.605mg
0.03mg
25%
Monounsaturated fat
1.056g
8.474g
19%
Copper
0.193mg
0.034mg
18%
Calories
76kcal
369kcal
15%
Zinc
0.8mg
2.08mg
12%
Selenium
8.9µg
14.5µg
10%
Folate
15µg
49µg
9%
Polyunsaturated fat
2.699g
1.32g
9%
Vitamin B6
0.047mg
0.124mg
6%
Choline
28.8mg
5%
Vitamin B1
0.081mg
0.04mg
3%
Vitamin B3
0.195mg
0.734mg
3%
Vitamin K
2.4µg
2%
Potassium
121mg
91mg
1%
Fiber
0.3g
0g
1%
Protein per 100 calories
11g
5.8g
N/A
Calories per 10 g protein
94kcal
171kcal
N/A
Weight per 100 calories
132g
27g
N/A
Unsaturated / Saturated Fat ratio
5.4
0.51
N/A
Vitamin C
0.1mg
0mg
0%
Net carbs
1.57g
2g
N/A
Carbs
1.87g
2g
0%
Magnesium
30mg
30mg
0%
Sugar
0.62g
N/A
Vitamin E
0.01mg
0%
Tryptophan
0.12mg
0.303mg
0%
Threonine
0.402mg
0.965mg
0%
Isoleucine
0.435mg
1.217mg
0%
Leucine
0.713mg
2.114mg
0%
Lysine
0.452mg
1.848mg
0%
Methionine
0.108mg
0.558mg
0%
Phenylalanine
0.428mg
1.023mg
0%
Valine
0.446mg
1.614mg
0%
Histidine
0.221mg
0.602mg
0%
Macronutrient Comparison
Macronutrient breakdown side-by-side comparison
1
8%
5%
2%
85%
Protein:
8.08 g
Fats:
4.78 g
Carbs:
1.87 g
Water:
84.55 g
Other:
0.72 g
4
22%
31%
2%
39%
6%
Protein:
21.54 g
Fats:
30.64 g
Carbs:
2 g
Water:
39.38 g
Other:
6.44 g
Contains
more
Water Water
+114.7%
Contains
more
Protein Protein
+166.6%
Contains
more
Fats Fats
+541%
Contains
more
Other Other
+794.4%
Fat Type Comparison
Fat type breakdown side-by-side comparison
2
16%
24%
61%
Saturated fat:
Sat. Fat
0.691 g
Monounsaturated fat:
Mono. Fat
1.056 g
Polyunsaturated fat:
Poly. Fat
2.699 g
1
66%
29%
5%
Saturated fat:
Sat. Fat
19.263 g
Monounsaturated fat:
Mono. Fat
8.474 g
Polyunsaturated fat:
Poly. Fat
1.32 g
Contains
less
Sat. Fat Saturated fat
-96.4%
Contains
more
Poly. Fat Polyunsaturated fat
+104.5%
Contains
more
Mono. Fat Monounsaturated fat
+702.5%