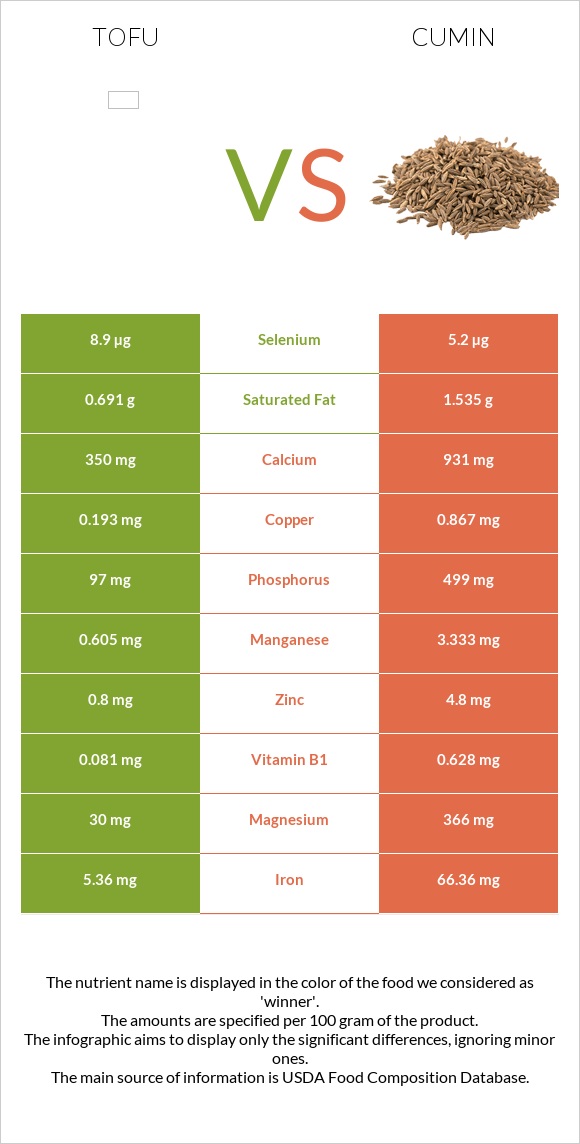
Differences between tofu and cumin Tofu contains less iron, manganese, magnesium, copper, calcium, phosphorus, potassium, vitamin B1, fiber, and zinc than cumin. Cumin's daily need coverage for iron is 763% higher. Cumin has a lower glycemic index. The glycemic index of cumin is 0, while the glycemic index of tofu is 15. The food types used in this comparison are Tofu, raw, regular, prepared with calcium sulfate and Spices, cumin seed .
Infographic
Mineral Comparison
Mineral comparison score is based on the number of minerals by which one or the other food is richer. The "coverage" charts below show how much of the daily needs can be covered by 300 grams of the food.
2
100 g
300 g
0.25 block - 116g 0.5 cup - 124g
Magnesium
Magnesium
Calcium
Calcium
Potassium
Potassium
Iron
Iron
Copper
Copper
Zinc
Zinc
Phosphorus
Phosphorus
Sodium
Sodium
Manganese
Manganese
Selenium
Selenium
21%
105%
11%
201%
64%
22%
42%
0.91%
79%
49%
8
100 g
300 g
0.25 tsp, whole - 0.5g 1 tbsp, whole - 6g
Magnesium
Magnesium
Calcium
Calcium
Potassium
Potassium
Iron
Iron
Copper
Copper
Zinc
Zinc
Phosphorus
Phosphorus
Sodium
Sodium
Manganese
Manganese
Selenium
Selenium
261%
279%
158%
2489%
289%
131%
214%
22%
435%
28%
Vitamin Comparison
Vitamin comparison score is based on the number of vitamins by which one or the other food is richer. The "coverage" charts below show how much of the daily needs can be covered by 300 grams of the food.
2
100 g
300 g
0.25 block - 116g 0.5 cup - 124g
Vitamin C
Vit. C
Vitamin D
Vit. D
Vitamin A
Vit. A
Vitamin E
Vit. E
Vitamin B1
Vit. B1
Vitamin B2
Vit. B2
Vitamin B3
Vit. B3
Vitamin B5
Vit. B5
Vitamin B6
Vit. B6
Vitamin B12
Vit. B12
Vitamin K
Vit. K
Folate
Folate
0.33%
0%
0%
0.2%
20%
12%
3.7%
4.1%
11%
0%
6%
11%
8
100 g
300 g
0.25 tsp, whole - 0.5g 1 tbsp, whole - 6g
Vitamin C
Vit. C
Vitamin D
Vit. D
Vitamin A
Vit. A
Vitamin E
Vit. E
Vitamin B1
Vit. B1
Vitamin B2
Vit. B2
Vitamin B3
Vit. B3
Vitamin B5
Vit. B5
Vitamin B6
Vit. B6
Vitamin B12
Vit. B12
Vitamin K
Vit. K
Folate
Folate
26%
0%
21%
67%
157%
75%
86%
0%
100%
0%
14%
7.5%
All nutrients comparison - raw data values
Nutrient
DV% diff.
Iron
5.36mg
66.36mg
763%
Manganese
0.605mg
3.333mg
119%
Magnesium
30mg
366mg
80%
Copper
0.193mg
0.867mg
75%
Calcium
350mg
931mg
58%
Phosphorus
97mg
499mg
57%
Potassium
121mg
1788mg
49%
Vitamin B1
0.081mg
0.628mg
46%
Fiber
0.3g
10.5g
41%
Zinc
0.8mg
4.8mg
36%
Monounsaturated fat
1.056g
14.04g
32%
Vitamin B6
0.047mg
0.435mg
30%
Fats
4.78g
22.27g
27%
Vitamin B3
0.195mg
4.579mg
27%
Vitamin E
0.01mg
3.33mg
22%
Vitamin B2
0.052mg
0.327mg
21%
Protein
8.08g
17.81g
19%
Calories
76kcal
375kcal
15%
Carbs
1.87g
44.24g
14%
Vitamin C
0.1mg
7.7mg
8%
Sodium
7mg
168mg
7%
Vitamin A
64µg
7%
Selenium
8.9µg
5.2µg
7%
Saturated fat
0.691g
1.535g
4%
Polyunsaturated fat
2.699g
3.279g
4%
Vitamin K
2.4µg
5.4µg
3%
Vitamin B5
0.068mg
1%
Folate
15µg
10µg
1%
Choline
28.8mg
24.7mg
1%
Protein per 100 calories
11g
4.7g
N/A
Calories per 10 g protein
94kcal
211kcal
N/A
Weight per 100 calories
132g
27g
N/A
Unsaturated / Saturated Fat ratio
5.4
11
N/A
Net carbs
1.57g
33.74g
N/A
Sugar
0.62g
2.25g
N/A
Tryptophan
0.12mg
0%
Threonine
0.402mg
0%
Isoleucine
0.435mg
0%
Leucine
0.713mg
0%
Lysine
0.452mg
0%
Methionine
0.108mg
0%
Phenylalanine
0.428mg
0%
Valine
0.446mg
0%
Histidine
0.221mg
0%
Macronutrient Comparison
Macronutrient breakdown side-by-side comparison
1
8%
5%
2%
85%
Protein:
8.08 g
Fats:
4.78 g
Carbs:
1.87 g
Water:
84.55 g
Other:
0.72 g
4
18%
22%
44%
8%
8%
Protein:
17.81 g
Fats:
22.27 g
Carbs:
44.24 g
Water:
8.06 g
Other:
7.62 g
Contains
more
Water Water
+949%
Contains
more
Protein Protein
+120.4%
Contains
more
Fats Fats
+365.9%
Contains
more
Carbs Carbs
+2265.8%
Contains
more
Other Other
+958.3%
Fat Type Comparison
Fat type breakdown side-by-side comparison
1
16%
24%
61%
Saturated fat:
Sat. Fat
0.691 g
Monounsaturated fat:
Mono. Fat
1.056 g
Polyunsaturated fat:
Poly. Fat
2.699 g
2
8%
74%
17%
Saturated fat:
Sat. Fat
1.535 g
Monounsaturated fat:
Mono. Fat
14.04 g
Polyunsaturated fat:
Poly. Fat
3.279 g
Contains
less
Sat. Fat Saturated fat
-55%
Contains
more
Mono. Fat Monounsaturated fat
+1229.5%
Contains
more
Poly. Fat Polyunsaturated fat
+21.5%