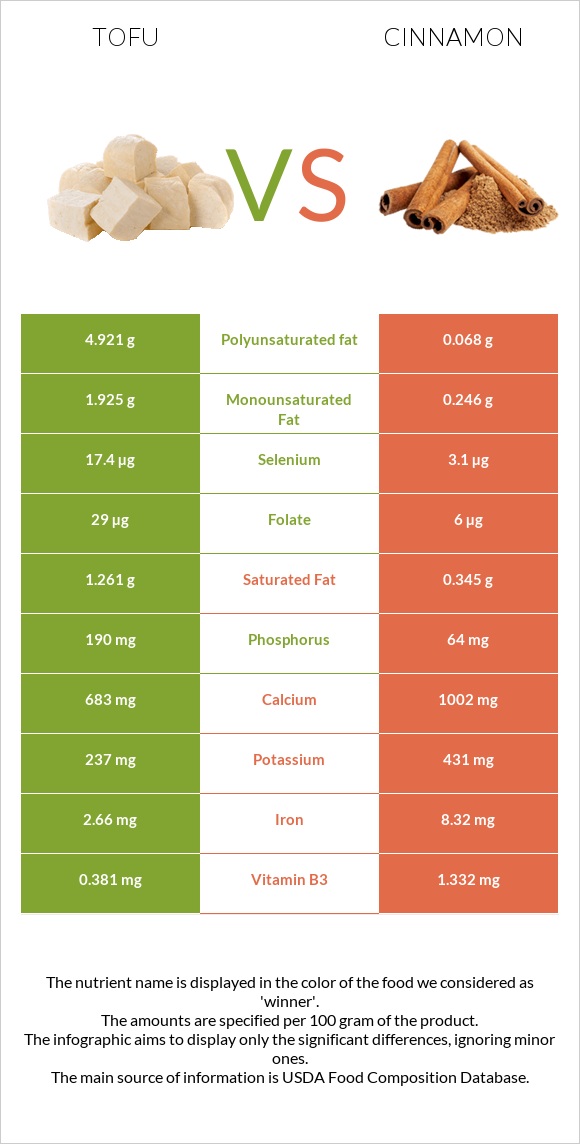
What are the main differences between tofu and cinnamon? Tofu is richer in selenium, phosphorus, vitamin B1, and folate, yet cinnamon is richer in manganese, fiber, iron, calcium, vitamin B3, and potassium. Cinnamon's daily need coverage for manganese is 708% higher. Tofu has 7 times more vitamin B1 than cinnamon. Tofu has 0.158mg of vitamin B1, while cinnamon has 0.022mg. We used Tofu, raw, firm, prepared with calcium sulfate and Spices, cinnamon, ground types in this comparison.
Infographic
Mineral Comparison
Mineral comparison score is based on the number of minerals by which one or the other food is richer. The "coverage" charts below show how much of the daily needs can be covered by 300 grams of the food.
3
100 g
300 g
0.25 block - 81g 0.5 cup - 126g
Magnesium
Magnesium
Calcium
Calcium
Potassium
Potassium
Iron
Iron
Copper
Copper
Zinc
Zinc
Phosphorus
Phosphorus
Sodium
Sodium
Manganese
Manganese
Selenium
Selenium
41%
205%
21%
100%
126%
43%
81%
1.8%
154%
95%
6
100 g
300 g
0.25 tsp - 0.5g 1 tbsp - 7.8g
Magnesium
Magnesium
Calcium
Calcium
Potassium
Potassium
Iron
Iron
Copper
Copper
Zinc
Zinc
Phosphorus
Phosphorus
Sodium
Sodium
Manganese
Manganese
Selenium
Selenium
43%
301%
38%
312%
113%
50%
27%
1.3%
2278%
17%
Vitamin Comparison
Vitamin comparison score is based on the number of vitamins by which one or the other food is richer. The "coverage" charts below show how much of the daily needs can be covered by 300 grams of the food.
3
100 g
300 g
0.25 block - 81g 0.5 cup - 126g
Vitamin C
Vit. C
Vitamin D
Vit. D
Vitamin A
Vit. A
Vitamin E
Vit. E
Vitamin B1
Vit. B1
Vitamin B2
Vit. B2
Vitamin B3
Vit. B3
Vitamin B5
Vit. B5
Vitamin B6
Vit. B6
Vitamin B12
Vit. B12
Vitamin K
Vit. K
Folate
Folate
0.67%
0%
0%
0%
40%
24%
7.1%
8%
21%
0%
0%
22%
7
100 g
300 g
0.25 tsp - 0.5g 1 tbsp - 7.8g
Vitamin C
Vit. C
Vitamin D
Vit. D
Vitamin A
Vit. A
Vitamin E
Vit. E
Vitamin B1
Vit. B1
Vitamin B2
Vit. B2
Vitamin B3
Vit. B3
Vitamin B5
Vit. B5
Vitamin B6
Vit. B6
Vitamin B12
Vit. B12
Vitamin K
Vit. K
Folate
Folate
13%
0%
5%
46%
5.5%
9.5%
25%
21%
36%
0%
78%
4.5%
All nutrients comparison - raw data values
Nutrient
DV% diff.
Manganese
1.181mg
17.466mg
708%
Fiber
2.3g
53.1g
203%
Iron
2.66mg
8.32mg
71%
Calcium
683mg
1002mg
32%
Polyunsaturated fat
4.921g
0.068g
32%
Protein
17.27g
3.99g
27%
Carbs
2.78g
80.59g
26%
Selenium
17.4µg
3.1µg
26%
Vitamin K
31.2µg
26%
Phosphorus
190mg
64mg
18%
Vitamin E
2.32mg
15%
Fats
8.72g
1.24g
12%
Vitamin B1
0.158mg
0.022mg
11%
Potassium
237mg
431mg
6%
Vitamin B3
0.381mg
1.332mg
6%
Folate
29µg
6µg
6%
Calories
144kcal
247kcal
5%
Vitamin B2
0.102mg
0.041mg
5%
Vitamin B5
0.133mg
0.358mg
5%
Vitamin B6
0.092mg
0.158mg
5%
Vitamin C
0.2mg
3.8mg
4%
Copper
0.378mg
0.339mg
4%
Saturated fat
1.261g
0.345g
4%
Monounsaturated fat
1.925g
0.246g
4%
Zinc
1.57mg
1.83mg
2%
Vitamin A
15µg
2%
Choline
11mg
2%
Fructose
1.11g
1%
Protein per 100 calories
12g
1.6g
N/A
Calories per 10 g protein
83kcal
619kcal
N/A
Weight per 100 calories
69g
40g
N/A
Unsaturated / Saturated Fat ratio
5.4
0.91
N/A
Net carbs
0.48g
27.49g
N/A
Magnesium
58mg
60mg
0%
Sugar
2.17g
N/A
Sodium
14mg
10mg
0%
Tryptophan
0.235mg
0.049mg
0%
Threonine
0.785mg
0.136mg
0%
Isoleucine
0.849mg
0.146mg
0%
Leucine
1.392mg
0.253mg
0%
Lysine
0.883mg
0.243mg
0%
Methionine
0.211mg
0.078mg
0%
Phenylalanine
0.835mg
0.146mg
0%
Valine
0.87mg
0.224mg
0%
Histidine
0.431mg
0.117mg
0%
Omega-3 - ALA
0.011g
N/A
Macronutrient Comparison
Macronutrient breakdown side-by-side comparison
3
17%
9%
3%
70%
Protein:
17.27 g
Fats:
8.72 g
Carbs:
2.78 g
Water:
69.83 g
Other:
1.4 g
2
4%
81%
11%
4%
Protein:
3.99 g
Fats:
1.24 g
Carbs:
80.59 g
Water:
10.58 g
Other:
3.6 g
Contains
more
Protein Protein
+332.8%
Contains
more
Fats Fats
+603.2%
Contains
more
Water Water
+560%
Contains
more
Carbs Carbs
+2798.9%
Contains
more
Other Other
+157.1%
Fat Type Comparison
Fat type breakdown side-by-side comparison
2
16%
24%
61%
Saturated fat:
Sat. Fat
1.261 g
Monounsaturated fat:
Mono. Fat
1.925 g
Polyunsaturated fat:
Poly. Fat
4.921 g
1
52%
37%
10%
Saturated fat:
Sat. Fat
0.345 g
Monounsaturated fat:
Mono. Fat
0.246 g
Polyunsaturated fat:
Poly. Fat
0.068 g
Contains
more
Mono. Fat Monounsaturated fat
+682.5%
Contains
more
Poly. Fat Polyunsaturated fat
+7136.8%
Contains
less
Sat. Fat Saturated fat
-72.6%