Tomatillo Salsa Verde vs. Cheese sauce — In-Depth Nutrition Comparison
Compare
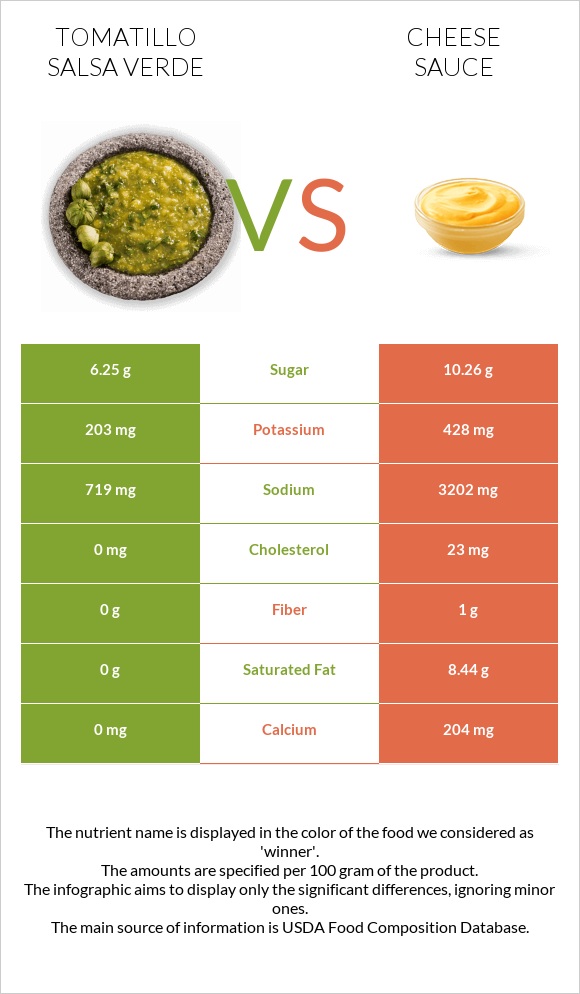
How are tomatillo Salsa Verde and cheese sauce different?
- Tomatillo Salsa Verde is richer in vitamin A, while cheese sauce is higher in calcium, potassium, and iron.
- Cheese sauce covers your daily need for sodium, 108% more than tomatillo Salsa Verde.
- Tomatillo Salsa Verde contains 3 times more vitamin A than cheese sauce. Tomatillo Salsa Verde contains 625 IU of vitamin A, while cheese sauce contains 202 IU.
- Tomatillo Salsa Verde is lower in sugar.
PACE, Salsa Verde and Sauce, cheese sauce mix, dry types were used in this article.
Infographic
Infographic link
Mineral Comparison
Mineral comparison score is based on the number of minerals by which one or the other food is richer. The "coverage" charts below show how much of the daily needs can be covered by 300 grams of the food.
| Contains less SodiumSodium | -77.5% |
| Contains more CalciumCalcium | +∞% |
| Contains more PotassiumPotassium | +110.8% |
| Contains more IronIron | +∞% |
Vitamin Comparison
Vitamin comparison score is based on the number of vitamins by which one or the other food is richer. The "coverage" charts below show how much of the daily needs can be covered by 300 grams of the food.
| Contains more Vitamin CVitamin C | +322.2% |
All nutrients comparison - raw data values
| Nutrient |  |
 |
DV% diff. |
| Sodium | 719mg | 3202mg | 108% |
| Vitamin B2 | 0.678mg | 52% | |
| Phosphorus | 283mg | 40% | |
| Saturated fat | 0g | 8.44g | 38% |
| Folate | 134µg | 34% | |
| Vitamin B5 | 1.499mg | 30% | |
| Fats | 1.56g | 18.33g | 26% |
| Calories | 47kcal | 438kcal | 20% |
| Calcium | 0mg | 204mg | 20% |
| Vitamin B12 | 0.46µg | 19% | |
| Carbs | 6.25g | 60.52g | 18% |
| Vitamin B1 | 0.211mg | 18% | |
| Monounsaturated fat | 6.868g | 17% | |
| Protein | 0g | 7.68g | 15% |
| Vitamin B3 | 2.399mg | 15% | |
| Vitamin B6 | 0.182mg | 14% | |
| Zinc | 1.11mg | 10% | |
| Magnesium | 36mg | 9% | |
| Copper | 0.085mg | 9% | |
| Cholesterol | 0mg | 23mg | 8% |
| Potassium | 203mg | 428mg | 7% |
| Polyunsaturated fat | 0.983g | 7% | |
| Iron | 0mg | 0.5mg | 6% |
| Vitamin A | 56µg | 6% | |
| Fiber | 0g | 1g | 4% |
| Vitamin C | 3.8mg | 0.9mg | 3% |
| Manganese | 0.052mg | 2% | |
| Protein per 100 calories | 0g | 1.8g | N/A |
| Calories per 10 g protein | 570kcal | N/A | |
| Weight per 100 calories | 213g | 23g | N/A |
| Unsaturated / Saturated Fat ratio | 0.93 | N/A | |
| Net carbs | 6.25g | 59.52g | N/A |
| Sugar | 6.25g | 10.26g | N/A |
Macronutrient Comparison
Macronutrient breakdown side-by-side comparison
Protein:
0 g
Fats:
1.56 g
Carbs:
6.25 g
Water:
88.1 g
Other:
4.09 g
Protein:
7.68 g
Fats:
18.33 g
Carbs:
60.52 g
Water:
3.78 g
Other:
9.69 g
| Contains more WaterWater | +2230.7% |
| Contains more ProteinProtein | +∞% |
| Contains more FatsFats | +1075% |
| Contains more CarbsCarbs | +868.3% |
| Contains more OtherOther | +136.9% |


