Turkey ham vs. Chicken liver — In-Depth Nutrition Comparison
Compare
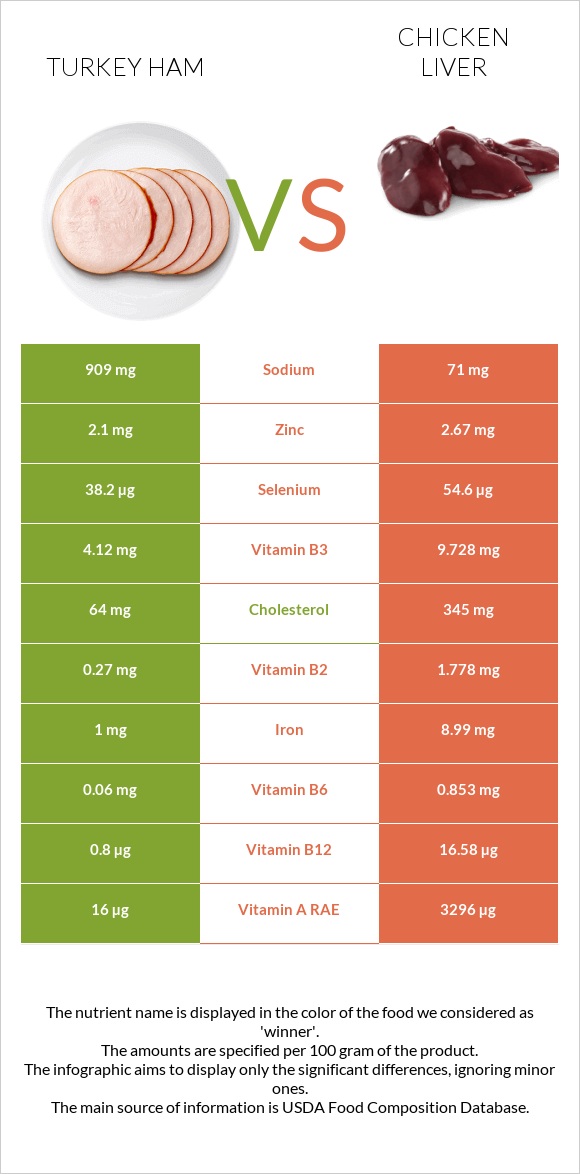
What are the differences between turkey ham and chicken liver?
- Chicken liver is richer than turkey ham in vitamin B12, vitamin A, vitamin B2, iron, vitamin B6, vitamin B3, selenium, and vitamin C.
- Chicken liver's daily need coverage for vitamin B12 is 657% more.
- Turkey ham has 13 times more sodium than chicken liver. While turkey ham has 909mg of sodium, chicken liver has only 71mg.
We used USDA Commodity, turkey ham, dark meat, smoked, frozen and Chicken, liver, all classes, raw types in this article.
Infographic
Infographic link
Mineral Comparison
Mineral comparison score is based on the number of minerals by which one or the other food is richer. The "coverage" charts below show how much of the daily needs can be covered by 300 grams of the food.
| Contains more MagnesiumMagnesium | +18.8% |
| Contains more CalciumCalcium | +14.3% |
| Contains more IronIron | +799% |
| Contains more ZincZinc | +27.1% |
| Contains less SodiumSodium | -92.2% |
| Contains more SeleniumSelenium | +42.9% |
Vitamin Comparison
Vitamin comparison score is based on the number of vitamins by which one or the other food is richer. The "coverage" charts below show how much of the daily needs can be covered by 300 grams of the food.
| Contains more Vitamin CVitamin C | +∞% |
| Contains more Vitamin AVitamin A | +20500% |
| Contains more Vitamin B1Vitamin B1 | +32.6% |
| Contains more Vitamin B2Vitamin B2 | +558.5% |
| Contains more Vitamin B3Vitamin B3 | +136.1% |
| Contains more Vitamin B6Vitamin B6 | +1321.7% |
| Contains more Vitamin B12Vitamin B12 | +1972.5% |
All nutrients comparison - raw data values
| Nutrient |  |
 |
DV% diff. |
| Vitamin B12 | 0.8µg | 16.58µg | 658% |
| Vitamin A | 16µg | 3296µg | 364% |
| Folate | 588µg | 147% | |
| Vitamin B5 | 6.233mg | 125% | |
| Vitamin B2 | 0.27mg | 1.778mg | 116% |
| Iron | 1mg | 8.99mg | 100% |
| Cholesterol | 64mg | 345mg | 94% |
| Vitamin B6 | 0.06mg | 0.853mg | 61% |
| Copper | 0.492mg | 55% | |
| Sodium | 909mg | 71mg | 36% |
| Vitamin B3 | 4.12mg | 9.728mg | 35% |
| Choline | 194.4mg | 35% | |
| Selenium | 38.2µg | 54.6µg | 30% |
| Vitamin C | 0mg | 17.9mg | 20% |
| Manganese | 0.255mg | 11% | |
| Vitamin B1 | 0.23mg | 0.305mg | 6% |
| Zinc | 2.1mg | 2.67mg | 5% |
| Vitamin E | 0.7mg | 5% | |
| Polyunsaturated fat | 0.873g | 1.306g | 3% |
| Saturated fat | 1.2g | 1.563g | 2% |
| Protein | 16.3g | 16.92g | 1% |
| Fats | 4g | 4.83g | 1% |
| Carbs | 3.1g | 0.73g | 1% |
| Magnesium | 16mg | 19mg | 1% |
| Potassium | 253mg | 230mg | 1% |
| Phosphorus | 289mg | 297mg | 1% |
| Calories | 118kcal | 119kcal | 0% |
| Protein per 100 calories | 14g | 14g | N/A |
| Calories per 10 g protein | 72kcal | 70kcal | N/A |
| Weight per 100 calories | 85g | 84g | N/A |
| Unsaturated / Saturated Fat ratio | 1.8 | 1.6 | N/A |
| Net carbs | 3.1g | 0.73g | N/A |
| Calcium | 7mg | 8mg | 0% |
| Sugar | 1.2g | 0g | N/A |
| Trans fat | 0.065g | N/A | |
| Monounsaturated fat | 1.337g | 1.249g | 0% |
| Tryptophan | 0.176mg | 0% | |
| Threonine | 0.725mg | 0% | |
| Isoleucine | 0.813mg | 0% | |
| Leucine | 1.512mg | 0% | |
| Lysine | 1.332mg | 0% | |
| Methionine | 0.432mg | 0% | |
| Phenylalanine | 0.824mg | 0% | |
| Valine | 0.998mg | 0% | |
| Histidine | 0.507mg | 0% | |
| Omega-3 - ALA | 0.006g | N/A | |
| Omega-6 - Gamma-linoleic acid | 0.006g | N/A | |
| Omega-6 - Eicosadienoic acid | 0.005g | N/A | |
| Omega-6 - Linoleic acid | 0.475g | N/A |
Macronutrient Comparison
Macronutrient breakdown side-by-side comparison
Protein:
16.3 g
Fats:
4 g
Carbs:
3.1 g
Water:
73.5 g
Other:
3.1 g
Protein:
16.92 g
Fats:
4.83 g
Carbs:
0.73 g
Water:
76.46 g
Other:
1.06 g
| Contains more CarbsCarbs | +324.7% |
| Contains more OtherOther | +192.5% |
| Contains more FatsFats | +20.8% |
~equal in
Protein
~16.92g
~equal in
Water
~76.46g
Fat Type Comparison
Fat type breakdown side-by-side comparison
Saturated fat:
Sat. Fat
1.2 g
Monounsaturated fat:
Mono. Fat
1.337 g
Polyunsaturated fat:
Poly. Fat
0.873 g
Saturated fat:
Sat. Fat
1.563 g
Monounsaturated fat:
Mono. Fat
1.249 g
Polyunsaturated fat:
Poly. Fat
1.306 g
| Contains less Sat. FatSaturated fat | -23.2% |
| Contains more Poly. FatPolyunsaturated fat | +49.6% |
~equal in
Monounsaturated fat
~1.249g


