Chicken liver nutrition: calories, carbs, GI, protein, fiber, fats
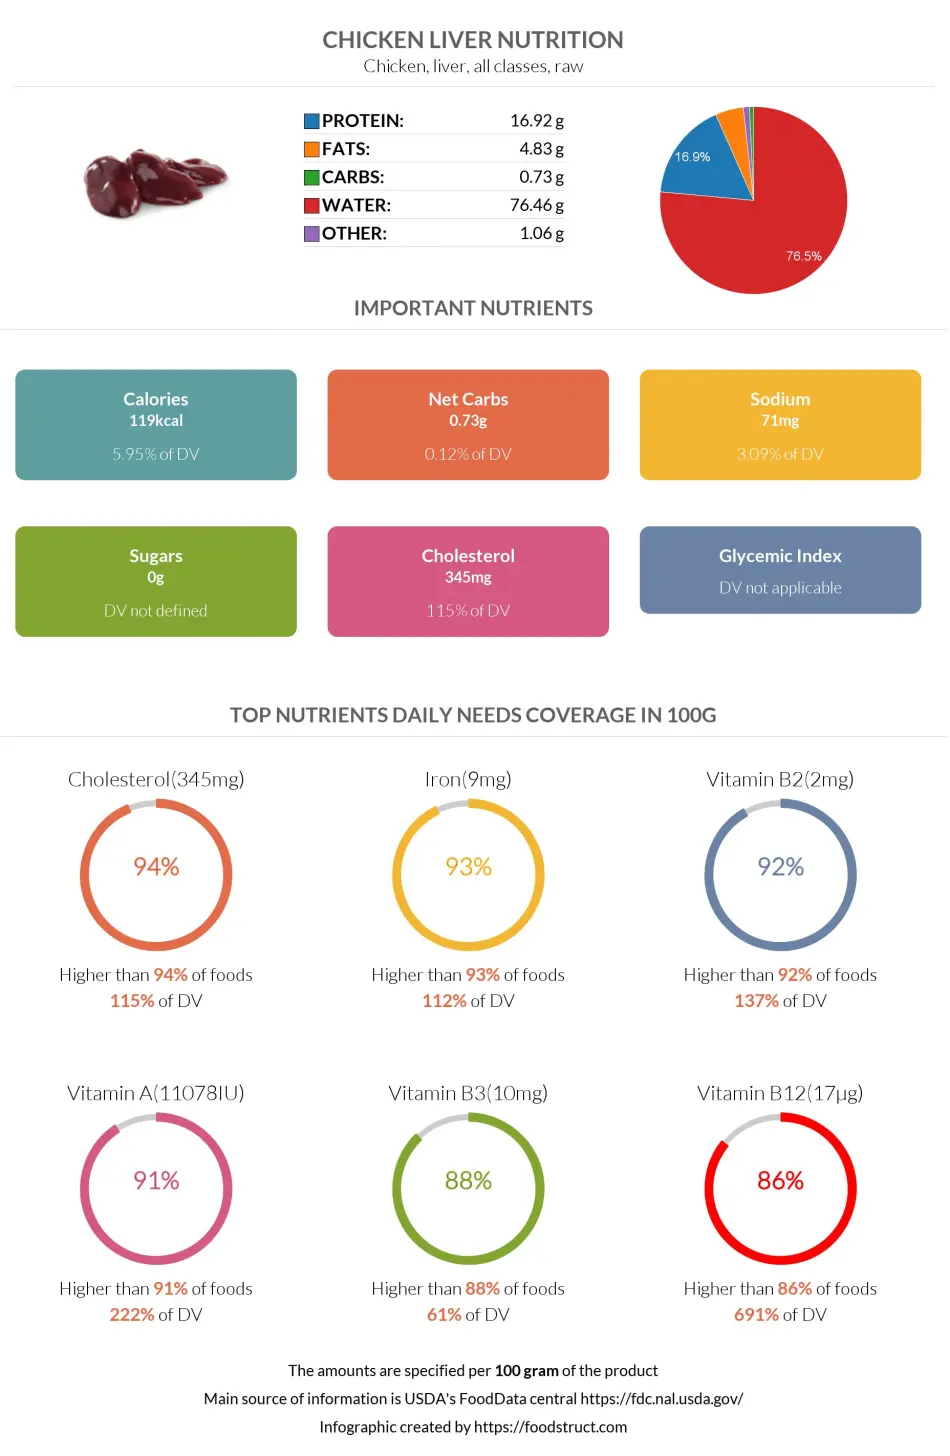
Chicken, liver, all classes, raw
*all the values are displayed for the amount of 100 grams
Top nutrition facts for Chicken liver
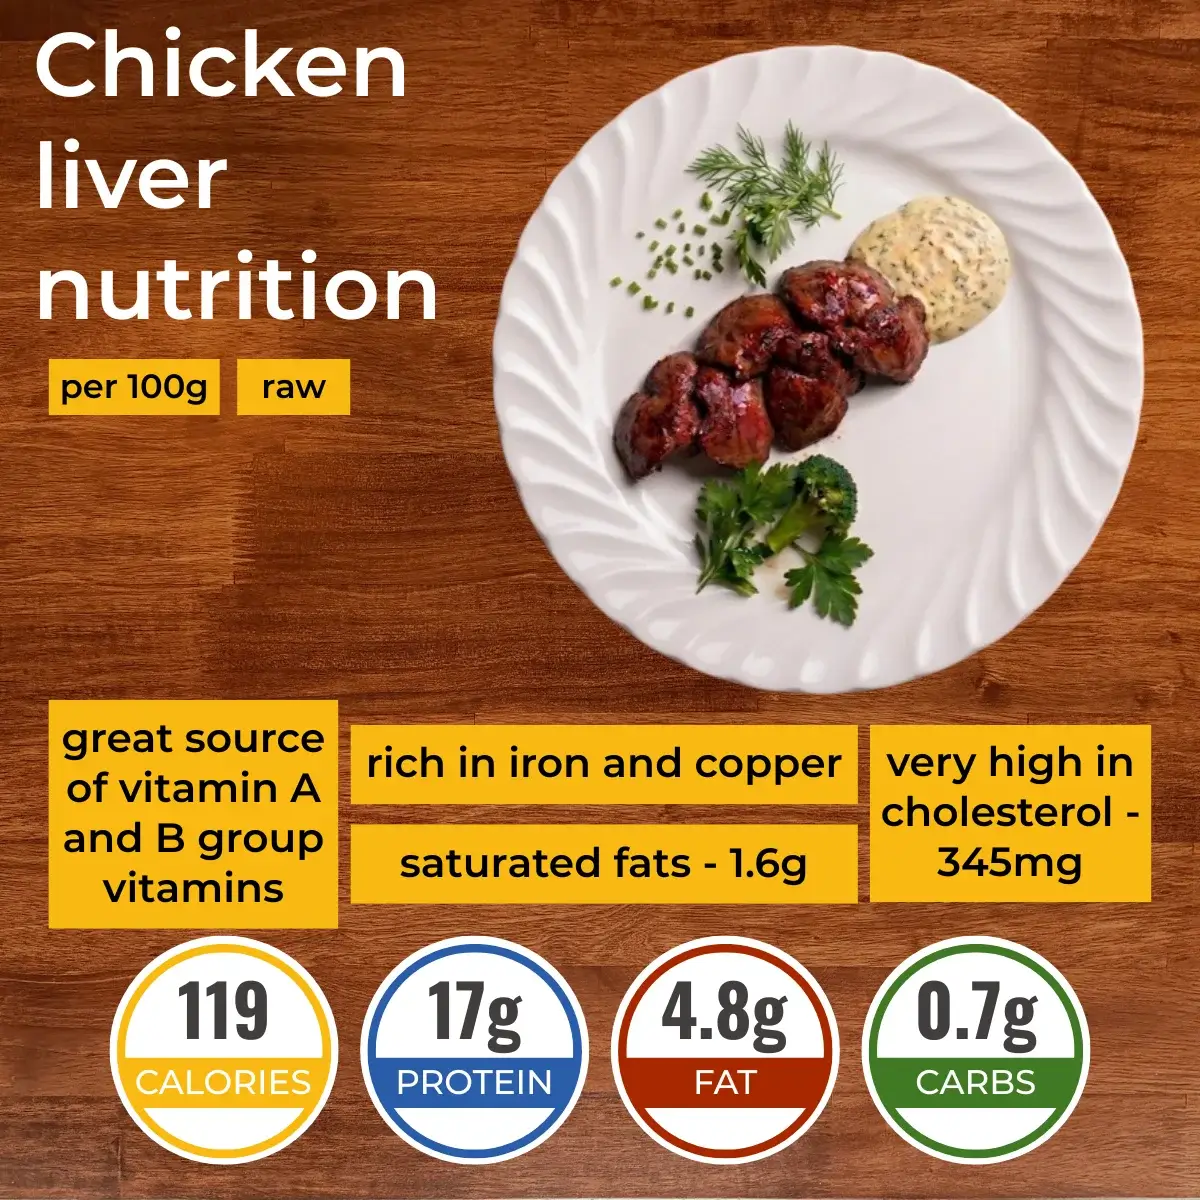
| Calories ⓘ Calories for selected serving | 119 kcal |
| Protein | 16.92 g |
| Cholesterol | 345 mg |
| Vitamin B12 | 16.58 µg |
| Iron | 8.99 mg |
|
Glycemic index ⓘ
Source: *Explanation
0.73g of net carbs
Check out our Glycemic index chart page for the full list.
|
0 (low) |
| Insulin index ⓘ The insulin index of foods demonstrates how much a food increases the insulin level in the blood, in the first two-hour period after consumption. | 19 ⓘ https://pubmed.ncbi.nlm.nih.gov/32414656/ - The insulin index for poultry organ meat. |
Vitamin A ⓘHigher in Vitamin A content than 99% of foods
Vitamin B12 ⓘHigher in Vitamin B12 content than 99% of foods
Choline ⓘHigher in Choline content than 99% of foods
Vitamin B5 ⓘHigher in Vitamin B5 content than 99% of foods
Vitamin B2 ⓘHigher in Vitamin B2 content than 98% of foods
Chicken liver calories (kcal)
| Calories for different serving sizes of chicken liver | Calories | Weight |
|---|---|---|
| Calories in 100 grams | 119 | |
| Calories in 1 liver | 52 | 44 g |
Extra Nutrition facts for Chicken liver
| Protein per 100 calories ⓘ Shows how many grams of protein you get from 100 calories of this food, calculated as (protein in g ÷ calories) × 100. | 14 g |
| Calories per 10 g protein ⓘ Shows how many calories you need to eat from this food to get 10 g of protein, calculated as (calories ÷ protein in g) × 10. | 70 kcal |
| Weight per 100 calories ⓘ Shows how many grams of this food equal 100 kcal—higher grams mean a larger portion for the same calories. | 84 g |
| Unsaturated / Saturated Fat ratio ⓘ (monounsaturated + polyunsaturated) / saturated, ≥2 broadly recommended by major guidelines for heart health | 1.6 |
| Purines ⓘ Purines are natural compounds found in many foods that get broken down into uric acid. While they are the essential building blocks for DNA and RNA, they can also contribute to gout when consumed in excess. | 325 mg ⓘ https://pmc.ncbi.nlm.nih.gov/articles/PMC10560991/ |
| Processing score ⓘ The processing score is a calculated value that looks at both how industrially made it is (NOVA) and how healthy/unprocessed the ingredients are (SIGA), then combines them into one score from 1 (least processed) to 4 (most processed). | 1.7 - Minimally processed ⓘ (Cooked, fried) NOVA score = 2, SIGA score = A1 |
| Acidity (Based on PRAL) ⓘ PRAL (Potential renal acid load) is calculated using a formula. On the PRAL scale the higher the positive value, the more is the acidifying effect on the body. The lower the negative value, the higher the alkalinity of the food. 0 is neutral. | 13.9 (acidic) |
| Oxalates | 0.4 mg ⓘ https://www.hsph.harvard.edu/nutrition-questionnaire-service-center/nutrient-tables-download-page/ |
Chicken liver Glycemic index (GI)
Mineral coverage chart
Mineral chart - relative view
Vitamin coverage chart
Vitamin A:
9888µg of 900µg
1099%
Vitamin E:
2.1mg of 15mg
14%
Vitamin D:
0µg of 20µg
0%
Vitamin C:
54mg of 90mg
60%
Vitamin B1:
0.92mg of 1mg
76%
Vitamin B2:
5.3mg of 1mg
410%
Vitamin B3:
29mg of 16mg
182%
Vitamin B5:
19mg of 5mg
374%
Vitamin B6:
2.6mg of 1mg
197%
Folate:
1764µg of 400µg
441%
Vitamin B12:
50µg of 2µg
2073%
Vitamin K:
0µg of 120µg
0%
Vitamin chart - relative view
Macronutrients chart
Protein:
Daily Value: 34%
16.9 g of 50 g
16.9 g (34% of DV )
Fats:
Daily Value: 7%
4.8 g of 65 g
4.8 g (7% of DV )
Carbs:
Daily Value: 0%
0.7 g of 300 g
0.7 g (0% of DV )
Water:
Daily Value: 4%
76.5 g of 2,000 g
76.5 g (4% of DV )
Other:
1.1 g
1.1 g
Protein quality breakdown
Tryptophan:
528mg of 280mg
189%
Threonine:
2175mg of 1,050mg
207%
Isoleucine:
2439mg of 1,400mg
174%
Leucine:
4536mg of 2,730mg
166%
Lysine:
3996mg of 2,100mg
190%
Methionine:
1296mg of 1,050mg
123%
Phenylalanine:
2472mg of 1,750mg
141%
Valine:
2994mg of 1,820mg
165%
Histidine:
1521mg of 700mg
217%
Fat type information
Saturated fat:
1.6 g
Monounsaturated fat:
1.2 g
Polyunsaturated fat:
1.3 g
All nutrients for Chicken liver per 100g
| Nutrient | Value | DV% | In TOP % of foods | Comparison |
| Vitamin A | 3296µg | 366% | 1% | |
| Calories | 119kcal | 6% | 69% |
2.5 times more than Orange
|
| Protein per 100 calories | 14g | N/A | 15% | |
| Protein | 17g | 40% | 31% |
6 times more than Broccoli
|
| Calories per 10 g protein | 70kcal | N/A | 82% | |
| Weight per 100 calories | 84g | N/A | 32% | |
| Fats | 4.8g | 7% | 52% |
6.9 times less than Cheese
|
| Unsaturated / Saturated Fat ratio | 1.6 | N/A | 53% | |
| Vitamin C | 18mg | 20% | 11% |
3 times less than Lemon
|
| Net carbs | 0.73g | N/A | 71% |
74.2 times less than Chocolate
|
| Carbs | 0.73g | 0% | 72% |
38.6 times less than Rice
|
| Cholesterol | 345mg | 115% | 2% |
1.1 times less than Egg
|
| Vitamin D* | 0 IU | 0% | 100% |
N/A
|
| Vitamin D | 0µg | 0% | 100% |
N/A
|
| Magnesium | 19mg | 5% | 56% |
7.4 times less than Almonds
|
| Calcium | 8mg | 1% | 79% |
15.6 times less than Milk
|
| Potassium | 230mg | 7% | 48% |
1.6 times more than Cucumber
|
| Iron | 9mg | 112% | 5% |
3.5 times more than Beef broiled
|
| Sugar | 0g | N/A | 100% |
N/A
|
| Fiber | 0g | 0% | 100% |
N/A
|
| Copper | 0.49mg | 55% | 6% |
3.5 times more than Shiitake
|
| Zinc | 2.7mg | 24% | 26% |
2.4 times less than Beef broiled
|
| Phosphorus | 297mg | 42% | 11% |
1.6 times more than Chicken meat
|
| Sodium | 71mg | 3% | 57% |
6.9 times less than White bread
|
| Vitamin E | 0.7mg | 5% | 19% |
2.1 times less than Kiwi
|
| Manganese | 0.26mg | 11% | 24% | |
| Selenium | 55µg | 99% | 2% | |
| Vitamin B1 | 0.31mg | 25% | 20% |
1.1 times more than Pea raw
|
| Vitamin B2 | 1.8mg | 137% | 2% |
13.7 times more than Avocado
|
| Vitamin B3 | 9.7mg | 61% | 6% |
Equal to Turkey meat
|
| Vitamin B5 | 6.2mg | 125% | 1% |
5.5 times more than Sunflower seeds
|
| Vitamin B6 | 0.85mg | 66% | 5% |
7.2 times more than Oats
|
| Vitamin B12 | 17µg | 691% | 1% |
23.7 times more than Pork
|
| Vitamin K | 0µg | 0% | 100% |
N/A
|
| Trans fat | 0.07g | N/A | 23% |
229.1 times less than Margarine
|
| Folate | 588µg | 147% | 2% |
9.6 times more than Brussels sprouts
|
| Saturated fat | 1.6g | 8% | 49% |
3.8 times less than Beef broiled
|
| Choline | 194mg | 35% | 1% | |
| Monounsaturated fat | 1.2g | N/A | 54% |
7.8 times less than Avocado
|
| Polyunsaturated fat | 1.3g | N/A | 33% |
36.1 times less than Walnut
|
| Tryptophan | 0.18mg | 0% | 27% |
1.7 times less than Chicken meat
|
| Threonine | 0.73mg | 0% | 27% |
Equal to Beef broiled
|
| Isoleucine | 0.81mg | 0% | 26% |
1.1 times less than Salmon raw
|
| Leucine | 1.5mg | 0% | 24% |
1.6 times less than Tuna Bluefin
|
| Lysine | 1.3mg | 0% | 27% |
2.9 times more than Tofu
|
| Methionine | 0.43mg | 0% | 27% |
4.5 times more than Quinoa
|
| Phenylalanine | 0.82mg | 0% | 22% |
1.2 times more than Egg
|
| Valine | 1mg | 0% | 22% |
2 times less than Soybean raw
|
| Histidine | 0.51mg | 0% | 27% |
1.5 times less than Turkey meat
|
| Caffeine | 0mg | 0% | 100% | |
| Omega-3 - EPA | 0g | N/A | 100% |
N/A
|
| Omega-3 - DHA | 0g | N/A | 100% |
N/A
|
| Omega-3 - ALA | 0.01g | N/A | 21% |
1523.3 times less than Canola oil
|
| Omega-3 - DPA | 0g | N/A | 100% |
N/A
|
| Omega-6 - Gamma-linoleic acid | 0.01g | N/A | 6% | |
| Omega-6 - Eicosadienoic acid | 0.01g | N/A | 12% | |
| Omega-6 - Linoleic acid | 0.48g | N/A | 12% |
25.9 times less than Almonds
|
Check out similar food or compare with current
NUTRITION FACTS LABEL
Nutrition Facts
___servings per container
Serving Size ______________
Serving Size ______________
Amount Per 100g
Calories 119
% Daily Value*
7.4%
Total Fat
4.8g
7.1%
Saturated Fat 1.6g
0
Trans Fat
0g
115%
Cholesterol 345mg
3.1%
Sodium 71mg
0.24%
Total Carbohydrate
0.73g
0
Dietary Fiber
0g
Total Sugars 0g
Includes ? g Added Sugars
Protein
17g
Vitamin D
0mcg
0
Calcium
8mg
0.8%
Iron
9mg
112%
Potassium
230mg
6.8%
*
The % Daily Value (DV) tells you how much a nutrient in a serving of food contributes to a daily diet. 2,000 calories a day is used for general nutrition advice.
Health checks
ⓘ
Dietary cholesterol is not associated with an increased risk of coronary heart disease in healthy individuals. However, dietary cholesterol is common in foods that are high in harmful saturated fats.
Source
Low in Cholesterol
ⓘ
Trans fat consumption increases the risk of cardiovascular disease and mortality by negatively affecting blood lipid levels.
Source
No Trans Fats
ⓘ
Saturated fat intake can raise total cholesterol and LDL (low-density lipoprotein) levels, leading to an increased risk of atherosclerosis. Dietary guidelines recommend limiting saturated fats to under 10% of calories a day.
Source
Low in Saturated Fats
ⓘ
While the consumption of moderate amounts of added sugars is not detrimental to health, an excessive intake can increase the risk of obesity, and therefore, diabetes.
Source
Low in Sugars
Chicken liver nutrition infographic
Infographic link
References
All the values for which the sources are not specified explicitly are taken from FDA’s Food Central. The exact link to the food presented on this page can be found below.