Infographic
Mineral Comparison
Mineral comparison score is based on the number of minerals by which one or the other food is richer. The "coverage" charts below show how much of the daily needs can be covered by 300 grams of the food.
8
100 g
300 g
1 package (2 oz) - 57g 1 package (2.06 oz, 2 bars) - 58g 1 package, king size (3.35 oz, 4 bars) - 95g 1 package (11 oz) - 312g
Magnesium
Magnesium
Calcium
Calcium
Potassium
Potassium
Iron
Iron
Copper
Copper
Zinc
Zinc
Phosphorus
Phosphorus
Sodium
Sodium
Manganese
Manganese
Selenium
Selenium
19%
32%
16%
30%
66%
29%
45%
26%
36%
23%
1
100 g
300 g
1 serving 1.6 oz bag - 47g
Magnesium
Magnesium
Calcium
Calcium
Potassium
Potassium
Iron
Iron
Copper
Copper
Zinc
Zinc
Phosphorus
Phosphorus
Sodium
Sodium
Manganese
Manganese
Selenium
Selenium
0%
27%
0%
32%
0%
0%
0%
18%
0%
0%
Vitamin Comparison
Vitamin comparison score is based on the number of vitamins by which one or the other food is richer. The "coverage" charts below show how much of the daily needs can be covered by 300 grams of the food.
11
100 g
300 g
1 package (2 oz) - 57g 1 package (2.06 oz, 2 bars) - 58g 1 package, king size (3.35 oz, 4 bars) - 95g 1 package (11 oz) - 312g
Vitamin C
Vit. C
Vitamin D
Vit. D
Vitamin A
Vit. A
Vitamin E
Vit. E
Vitamin B1
Vit. B1
Vitamin B2
Vit. B2
Vitamin B3
Vit. B3
Vitamin B5
Vit. B5
Vitamin B6
Vit. B6
Vitamin B12
Vit. B12
Vitamin K
Vit. K
Folate
Folate
2%
0%
6.7%
15%
39%
48%
21%
16%
5.8%
41%
14%
20%
0
100 g
300 g
1 serving 1.6 oz bag - 47g
Vitamin C
Vit. C
Vitamin D
Vit. D
Vitamin A
Vit. A
Vitamin E
Vit. E
Vitamin B1
Vit. B1
Vitamin B2
Vit. B2
Vitamin B3
Vit. B3
Vitamin B5
Vit. B5
Vitamin B6
Vit. B6
Vitamin B12
Vit. B12
Vitamin K
Vit. K
Folate
Folate
1.7%
0%
0%
0%
0%
0%
0%
0%
0%
0%
0%
0%
All nutrients comparison - raw data values
Macronutrient Comparison
Macronutrient breakdown side-by-side comparison
3
5%
25%
65%
4%
Protein:
4.91 g
Fats:
24.85 g
Carbs:
64.8 g
Water:
4.23 g
Other:
1.21 g
2
4%
19%
72%
2%
2%
Protein:
4.28 g
Fats:
19.32 g
Carbs:
72.4 g
Water:
1.7 g
Other:
2.3 g
Contains
more
Protein Protein
+14.7%
Contains
more
Fats Fats
+28.6%
Contains
more
Water Water
+148.8%
Contains
more
Carbs Carbs
+11.7%
Contains
more
Other Other
+90.1%
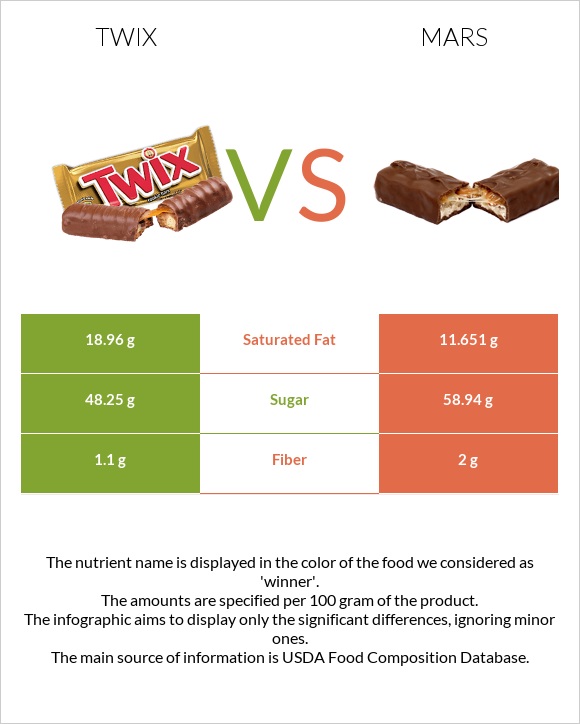
Fat Type Comparison
Fat type breakdown side-by-side comparison
2
84%
13%
3%
Saturated fat:
Sat. Fat
18.96 g
Monounsaturated fat:
Mono. Fat
2.988 g
Polyunsaturated fat:
Poly. Fat
0.628 g
1
100%
Saturated fat:
Sat. Fat
11.651 g
Monounsaturated fat:
Mono. Fat
0 g
Polyunsaturated fat:
Poly. Fat
0 g
Contains
more
Mono. Fat Monounsaturated fat
+∞%
Contains
more
Poly. Fat Polyunsaturated fat
+∞%
Contains
less
Sat. Fat Saturated fat
-38.5%