Veal vs. Chicken meat — Health Impact and Nutrition Comparison


Summary
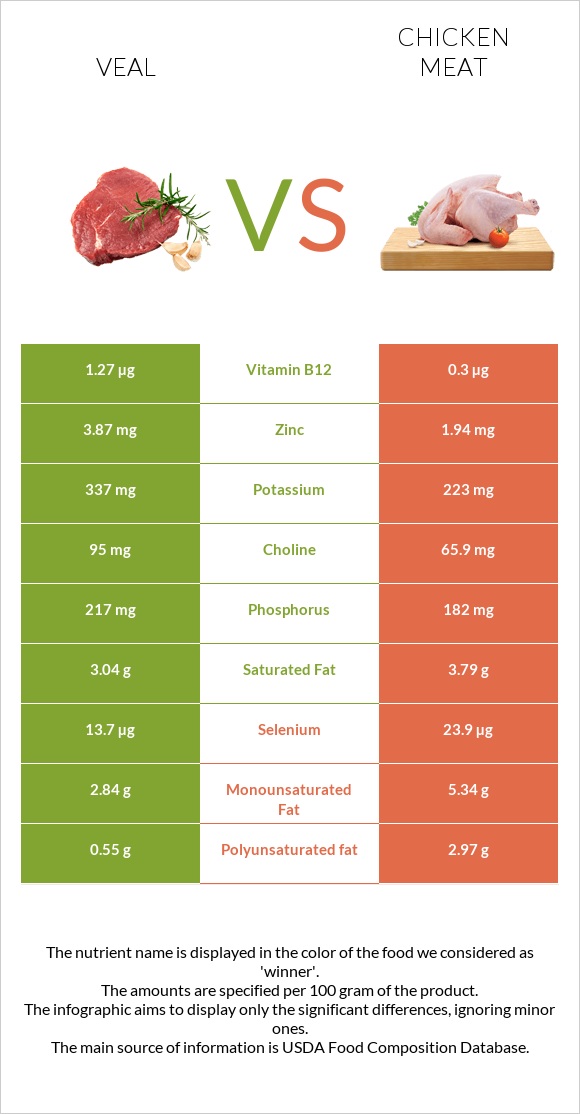
Chicken with skin is higher in calories and fats. However, it is richer in protein, selenium, iron, vitamins A, E, and K. In comparison, veal is 4 times richer in vitamin B12 and 2 times richer in zinc. It is also richer in B complex vitamins and most minerals.
Introduction
In recent years, the question of red meat vs. white meat has become more prevalent. Since veal is red meat and chicken is white meat will compare veal vs. chicken meat according to their nutritional differences and health impacts.
Classification
Veal is the meat of young and domesticated cows and bulls, also known as calves. Veal is classified as red meat, which gets its dark coloring from a high content of iron-containing protein called myoglobin.
On the other hand, chicken is classified as poultry and white meat as it is lower in myoglobin. Chicken legs and wings are darker in color compared to chicken breasts; however, they are still classified as white meat. The dark color of the wings and thighs come from their slightly higher myoglobin content compared to chicken breast.
Taste and Use
Chicken and veal both have mild flavors, which are usually enhanced with the help of seasonings, such as salt, black pepper, basil, rosemary, cayenne pepper, garlic powder, etc.
One main difference is the texture. Veal is the meat of a younger animal and is usually more tender. This means that it tends to cook faster than chicken. Veal also tends to be more delicate, so it can be more prone to drying out if overcooked.
When making a chicken roast or cooking veal cutlets, it can be incredibly helpful to use a meat thermometer to ensure it is cooked to the proper internal temperature. The recommended internal temperature by the USDA for chicken is 165°F (74°C), while it is 145°F (63°C) for veal. These temperatures ensure the proper cooking process and both meat and the death of pathogenic microbes to prevent foodborne infections and intoxication.
You can also read about veal vs. lamb in this article.
Nutrition
The nutritional information below is presented for ground, broiled veal, and roasted chicken broilers or fryers with meat and skin.
Chicken and veal are both lean meats and good sources of animal protein, but there are differences in their nutritional contents.
Macronutrients and Calories
The average serving size of chicken per person is double that of veal. Chicken’s average serving size is one cup of chopped or diced meat, equal to 140g. The mean serving size of veal is 3 ounces (oz) or 85g.
Below, we will compare equal 100g servings of both foods to get a fair idea of their nutritional differences.
Calories
Roasted chicken with skin is also considerably higher in calories than veal. A 100g serving of chicken with skin provides 239 calories, while the same serving size of veal contains 172 kcal.
However, it has to be mentioned that roasted chicken without skin contains considerably fewer calories - only 167 per 100g serving (1).
Protein
Chicken meat with skin is a better source of protein compared to veal. A 100g of chicken meat provides 65% of the daily needed value of protein, while the same serving of veal provides 58%.
Chicken contains 27g of protein, and in comparison, veal contains 24g of protein.
Chicken and veal contain high amounts of all essential amino acids. Chicken meat is richer in all of them except for histidine and valine.
Fats
Chicken with skin is also considerably higher in fats than veal. Per 100g serving, chicken with skin provides 6g more fats compared to veal.
However, most of the fat is stored in the chicken skin. Roasted chicken without skin contains slightly fewer fats than veal.
The fat composition of chicken can be considered more beneficial, as it contains more polyunsaturated and monounsaturated fats but nearly the same amount of saturated fats.
Chicken and veal are both high-cholesterol foods.
However, chicken meat with skin contains less cholesterol. Chicken contains 88mg of cholesterol, while veal has 103mg of cholesterol per 100g serving.
Carbohydrates
Their carbohydrate amount is negligible.
Vitamins
Veal is a better source of most B-group vitamins, including vitamins B2, B5, and B12.
Veal is over 4 times richer in vitamin B12.
Chicken, on the other hand, contains vitamin A, which veal lacks entirely. Chicken is also richer in fat-soluble vitamin E and vitamin K.
Vitamin Comparison
Contains
more
Vitamin B2Vitamin B2
+60.7%
Contains
more
Vitamin B5Vitamin B5
+12.6%
Contains
more
Vitamin B12Vitamin B12
+323.3%
Contains
more
FolateFolate
+120%
Contains
more
Vitamin AVitamin A
+∞%
Contains
more
Vitamin EVitamin E
+80%
Contains
more
Vitamin KVitamin K
+100%
Minerals
Veal is the winner in this category, being a better source of zinc, copper, potassium, phosphorus, and calcium.
More accurately, veal is 2 times richer in zinc.
Surprisingly, despite being white meat, chicken is richer in iron. It is also richer in selenium.
Without additionally added salt, the two contain similar amounts of sodium.
Mineral Comparison
Contains
more
CalciumCalcium
+13.3%
Contains
more
PotassiumPotassium
+51.1%
Contains
more
CopperCopper
+56.1%
Contains
more
ZincZinc
+99.5%
Contains
more
PhosphorusPhosphorus
+19.2%
Contains
more
ManganeseManganese
+75%
Contains
more
IronIron
+27.3%
Contains
more
SeleniumSelenium
+74.5%
Health Impact
Overall, red meat, including veal, has been researched to have various adverse effects on health, increasing the risk of heart disease, diabetes, cancer, and even premature death (2).
It can be said that unprocessed chicken meat is associated with a lower risk of adverse effects on health compared to veal.
You can find more detailed information about the health impact of red meat on our page.
Cardiovascular Health
Unlike poultry, an increased intake of red meat has been researched to lead to a higher risk of cardiovascular disease (3).
Studies have also found that poultry intake has neutral, while red meat intake has adverse outcomes on cardiovascular effects related to obesity, weight gain, and stroke risk (4).
Research suggests that poultry, such as chicken, is a healthier alternative to red meat, such as veal when it comes to cardiovascular health (5).
It is important to mention that the consumption of red meat in moderation has its benefits aswell. Processed red meat can pose a risk to overall health aswell, but the amount also has to be taken into consideration.
Diabetes
Chicken and veal both have a glycemic index of 0, as they do not contain carbohydrates. However, once again, red meat has been researched to increase the risk of developing diabetes and metabolic syndrome (6, 7).
The risk of developing diabetes can also depend on how you cook the meat. Frequently cooking meats at high temperatures, such as grilling or barbecuing, increases the risk of type 2 diabetes compared to cooking meats at moderate temperatures, such as stir-frying, sautéing, boiling, or steaming (8).
Cancer
There is strong scientific evidence that high consumption of red meat leads to an increased risk of colorectal cancer. The most specific increase of risk is with processed meats and nitrogen containing compounds added to it(9).
Red meat, such as veal, can also increase the risk of nasopharyngeal, lung, and pancreatic cancers (9).
According to the WHO and IARC, processed red meat is considered a class I carcinogen, and unprocessed red meat is considered a class 2A carcinogen (11)(12). However, IARC does not take into consideration the dosage of consumption, which is an important variable in this.
Poultry intake has potential positive associations with the risk of prostate cancer and non-Hodgkin lymphoma (10).
Anemia
Chicken and veal meats are rich sources of iron. In this comparison, chicken is a richer source. This, in turn, reduces the risks of iron deficiency anemia (13).
Weightloss
Veal and chicken increase satiety when associated with meals and are important to consume with meals so that you increase satiety and are great foods for weight management (14).
References
- https://fdc.nal.usda.gov/fdc-app.html#/food-details/172395/nutrients
- https://www.health.harvard.edu/staying-healthy/whats-the-beef-with-red-meat
- https://www.ncbi.nlm.nih.gov/pmc/articles/PMC10194058/
- https://www.saxinstitute.org.au/wp-content/uploads/Evidence-Check_Animal-sourced-protein-meat-and-poultry-and-heart-health.pdf
- https://pubmed.ncbi.nlm.nih.gov/34542332/
- https://www.ncbi.nlm.nih.gov/pmc/articles/PMC3173026/
- https://www.frontiersin.org/articles/10.3389/fnut.2021.691848/full
- https://www.hsph.harvard.edu/nutritionsource/2018/03/23/how-meat-is-cooked-may-affect-risk-of-type-2-diabetes/
- https://www.aicr.org/cancer-prevention/food-facts/red-meat-beef-pork-lamb/
- https://jech.bmj.com/content/73/Suppl_1/A15.1
- https://www.researchgate.net/figure/ARCs-classification-of-red-and-processed-meat-Processed-meat-has-been-classified-as_fig1_322506640
- https://www.who.int/news-room/questions-and-answers/item/cancer-carcinogenicity-of-the-consumption-of-red-meat-and-processed-meat
- https://www.ncbi.nlm.nih.gov/pmc/articles/PMC4772052/
- https://pubmed.ncbi.nlm.nih.gov/18469287/

Infographic
All nutrients comparison - raw data values
| Nutrient | |
|
DV% diff. |
| Vitamin B12 | 1.27µg | 0.3µg | 40% |
| Selenium | 13.7µg | 23.9µg | 19% |
| Zinc | 3.87mg | 1.94mg | 18% |
| Polyunsaturated fat | 0.55g | 2.97g | 16% |
| Fats | 7.56g | 13.6g | 9% |
| Vitamin B2 | 0.27mg | 0.168mg | 8% |
| Protein | 24.38g | 27.3g | 6% |
| Monounsaturated fat | 2.84g | 5.34g | 6% |
| Cholesterol | 103mg | 88mg | 5% |
| Phosphorus | 217mg | 182mg | 5% |
| Vitamin A | 0µg | 48µg | 5% |
| Choline | 95mg | 65.9mg | 5% |
| Copper | 0.103mg | 0.066mg | 4% |
| Calories | 172kcal | 239kcal | 3% |
| Potassium | 337mg | 223mg | 3% |
| Iron | 0.99mg | 1.26mg | 3% |
| Vitamin B3 | 8.03mg | 8.487mg | 3% |
| Vitamin B5 | 1.16mg | 1.03mg | 3% |
| Saturated fat | 3.04g | 3.79g | 3% |
| Folate | 11µg | 5µg | 2% |
| Vitamin E | 0.15mg | 0.27mg | 1% |
| Manganese | 0.035mg | 0.02mg | 1% |
| Vitamin B1 | 0.07mg | 0.063mg | 1% |
| Vitamin B6 | 0.39mg | 0.4mg | 1% |
| Vitamin K | 1.2µg | 2.4µg | 1% |
| Protein per 100 calories | 14g | 11g | N/A |
| Calories per 10 g protein | 71kcal | 88kcal | N/A |
| Weight per 100 calories | 58g | 42g | N/A |
| Unsaturated / Saturated Fat ratio | 1.1 | 2.2 | N/A |
| Vitamin D* | 0 IU | 2 IU | 0% |
| Magnesium | 24mg | 23mg | 0% |
| Calcium | 17mg | 15mg | 0% |
| Sodium | 83mg | 82mg | 0% |
| Tryptophan | 0.247mg | 0.305mg | 0% |
| Threonine | 1.065mg | 1.128mg | 0% |
| Isoleucine | 1.201mg | 1.362mg | 0% |
| Leucine | 1.94mg | 1.986mg | 0% |
| Lysine | 2.009mg | 2.223mg | 0% |
| Methionine | 0.569mg | 0.726mg | 0% |
| Phenylalanine | 0.984mg | 1.061mg | 0% |
| Valine | 1.347mg | 1.325mg | 0% |
| Histidine | 0.885mg | 0.802mg | 0% |
| Omega-3 - EPA | 0g | 0.01g | N/A |
| Omega-3 - DHA | 0g | 0.04g | N/A |
| Omega-3 - DPA | 0g | 0.02g | N/A |
Macronutrient Comparison
| Contains more WaterWater | +12.3% |
| Contains more OtherOther | +∞% |
| Contains more ProteinProtein | +12% |
| Contains more FatsFats | +79.9% |
Fat Type Comparison
| Contains less Sat. FatSaturated fat | -19.8% |
| Contains more Mono. FatMonounsaturated fat | +88% |
| Contains more Poly. FatPolyunsaturated fat | +440% |
People also compare


References
All the values for which the sources are not specified explicitly are taken from FDA’s Food Central. The exact link to the food presented on this page can be found below.
- Veal - https://fdc.nal.usda.gov/fdc-app.html#/food-details/175291/nutrients
- Chicken meat - https://fdc.nal.usda.gov/fdc-app.html#/food-details/171450/nutrients
All the Daily Values are presented for males aged 31-50, for 2000-calorie diets.