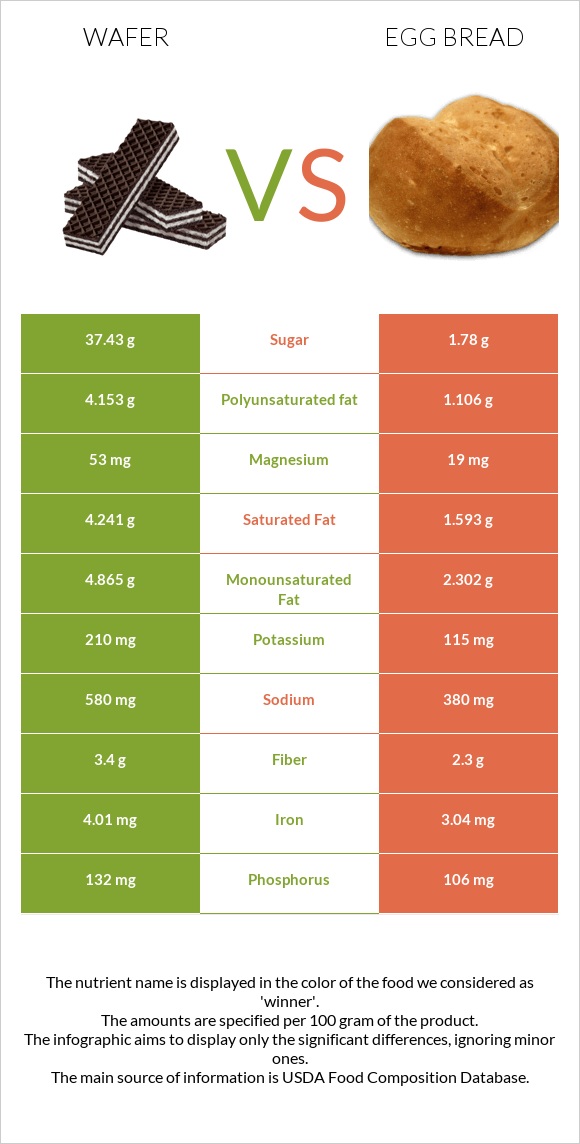
The main differences between wafer and egg bread Wafer is richer in copper and iron, yet egg bread is richer in selenium, vitamin B1, folate, vitamin B2, choline, and vitamin B3. Daily need coverage for selenium for egg bread is 44% higher. Wafer contains 3 times more copper than egg bread. Wafer contains 0.463mg of copper, while egg bread contains 0.162mg. Egg bread contains less saturated fat. Food types used in this article are Cookies, chocolate wafers and Bread, egg .
Infographic
Mineral Comparison
Mineral comparison score is based on the number of minerals by which one or the other food is richer. The "coverage" charts below show how much of the daily needs can be covered by 300 grams of the food.
7
100 g
300 g
1 wafer - 6g 1 oz - 28.35g 1 cup, crumbs - 112g
Magnesium
Magnesium
Calcium
Calcium
Potassium
Potassium
Iron
Iron
Copper
Copper
Zinc
Zinc
Phosphorus
Phosphorus
Sodium
Sodium
Manganese
Manganese
Selenium
Selenium
38%
9.3%
19%
150%
154%
30%
57%
76%
91%
31%
3
100 g
300 g
1 oz - 28.35g 1 slice (5" x 3" x 1/2") - 40g
Magnesium
Magnesium
Calcium
Calcium
Potassium
Potassium
Iron
Iron
Copper
Copper
Zinc
Zinc
Phosphorus
Phosphorus
Sodium
Sodium
Manganese
Manganese
Selenium
Selenium
14%
28%
10%
114%
54%
22%
45%
50%
65%
164%
Vitamin Comparison
Vitamin comparison score is based on the number of vitamins by which one or the other food is richer. The "coverage" charts below show how much of the daily needs can be covered by 300 grams of the food.
3
100 g
300 g
1 wafer - 6g 1 oz - 28.35g 1 cup, crumbs - 112g
Vitamin C
Vit. C
Vitamin D
Vit. D
Vitamin A
Vit. A
Vitamin E
Vit. E
Vitamin B1
Vit. B1
Vitamin B2
Vit. B2
Vitamin B3
Vit. B3
Vitamin B5
Vit. B5
Vitamin B6
Vit. B6
Vitamin B12
Vit. B12
Vitamin K
Vit. K
Folate
Folate
0%
0%
1%
14%
51%
61%
54%
23%
12%
11%
6%
35%
8
100 g
300 g
1 oz - 28.35g 1 slice (5" x 3" x 1/2") - 40g
Vitamin C
Vit. C
Vitamin D
Vit. D
Vitamin A
Vit. A
Vitamin E
Vit. E
Vitamin B1
Vit. B1
Vitamin B2
Vit. B2
Vitamin B3
Vit. B3
Vitamin B5
Vit. B5
Vitamin B6
Vit. B6
Vitamin B12
Vit. B12
Vitamin K
Vit. K
Folate
Folate
0%
6%
21%
5.2%
110%
101%
91%
17%
15%
13%
2.3%
79%
All nutrients comparison - raw data values
Nutrient
DV% diff.
Selenium
5.7µg
30.1µg
44%
Copper
0.463mg
0.162mg
33%
Vitamin B1
0.203mg
0.438mg
20%
Polyunsaturated fat
4.153g
1.106g
20%
Cholesterol
2mg
51mg
16%
Folate
47µg
105µg
15%
Fats
14.2g
6g
13%
Vitamin B2
0.266mg
0.436mg
13%
Choline
14.3mg
84.3mg
13%
Iron
4.01mg
3.04mg
12%
Vitamin B3
2.858mg
4.848mg
12%
Saturated fat
4.241g
1.593g
12%
Sodium
580mg
380mg
9%
Manganese
0.696mg
0.5mg
9%
Carbs
72.7g
47.8g
8%
Magnesium
53mg
19mg
8%
Calories
433kcal
287kcal
7%
Vitamin A
3µg
63µg
7%
Protein
6.6g
9.5g
6%
Calcium
31mg
93mg
6%
Monounsaturated fat
4.865g
2.302g
6%
Fiber
3.4g
2.3g
4%
Phosphorus
132mg
106mg
4%
Potassium
210mg
115mg
3%
Zinc
1.09mg
0.79mg
3%
Vitamin E
0.72mg
0.26mg
3%
Caffeine
10mg
0mg
3%
Vitamin D*
0 IU
16 IU
2%
Vitamin D
0µg
0.4µg
2%
Vitamin B5
0.381mg
0.282mg
2%
Vitamin B6
0.051mg
0.064mg
1%
Vitamin K
2.4µg
0.9µg
1%
Protein per 100 calories
1.5g
3.3g
N/A
Calories per 10 g protein
656kcal
302kcal
N/A
Weight per 100 calories
23g
35g
N/A
Unsaturated / Saturated Fat ratio
2.1
2.1
N/A
Net carbs
69.3g
45.5g
N/A
Sugar
37.43g
1.78g
N/A
Vitamin B12
0.09µg
0.1µg
0%
Tryptophan
0.096mg
0.112mg
0%
Threonine
0.22mg
0.306mg
0%
Isoleucine
0.261mg
0.394mg
0%
Leucine
0.447mg
0.692mg
0%
Lysine
0.281mg
0.311mg
0%
Methionine
0.105mg
0.189mg
0%
Phenylalanine
0.308mg
0.475mg
0%
Valine
0.323mg
0.443mg
0%
Histidine
0.128mg
0.21mg
0%
Omega-3 - EPA
0.003g
0.001g
N/A
Omega-3 - DHA
0.002g
0.012g
N/A
Macronutrient Comparison
Macronutrient breakdown side-by-side comparison
2
7%
14%
73%
5%
2%
Protein:
6.6 g
Fats:
14.2 g
Carbs:
72.7 g
Water:
4.5 g
Other:
2 g
2
10%
6%
48%
35%
2%
Protein:
9.5 g
Fats:
6 g
Carbs:
47.8 g
Water:
34.7 g
Other:
2 g
Contains
more
Fats Fats
+136.7%
Contains
more
Carbs Carbs
+52.1%
Contains
more
Protein Protein
+43.9%
Contains
more
Water Water
+671.1%
Fat Type Comparison
Fat type breakdown side-by-side comparison
2
32%
37%
31%
Saturated fat:
Sat. Fat
4.241 g
Monounsaturated fat:
Mono. Fat
4.865 g
Polyunsaturated fat:
Poly. Fat
4.153 g
1
32%
46%
22%
Saturated fat:
Sat. Fat
1.593 g
Monounsaturated fat:
Mono. Fat
2.302 g
Polyunsaturated fat:
Poly. Fat
1.106 g
Contains
more
Mono. Fat Monounsaturated fat
+111.3%
Contains
more
Poly. Fat Polyunsaturated fat
+275.5%
Contains
less
Sat. Fat Saturated fat
-62.4%