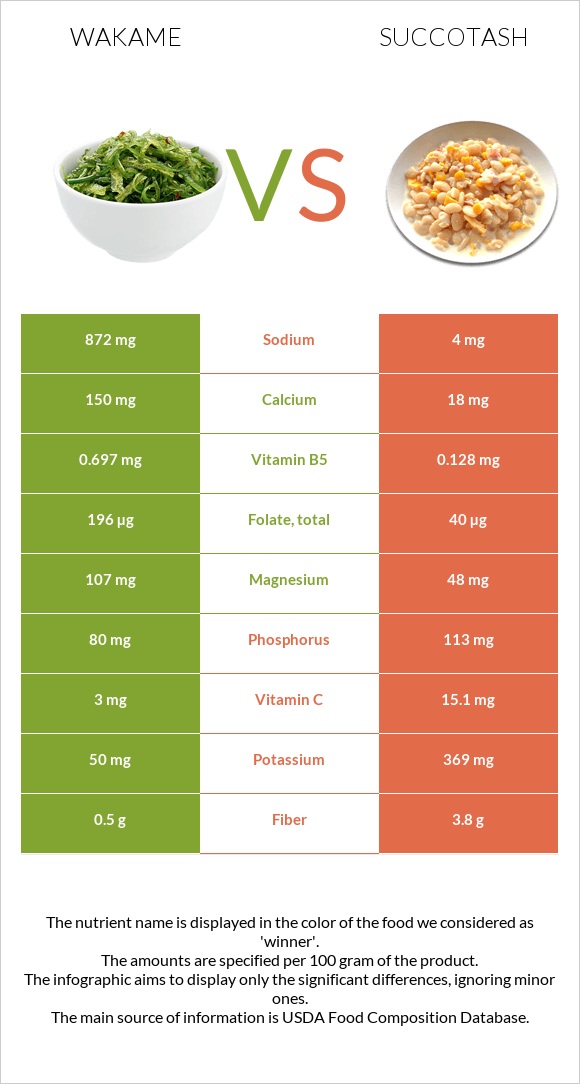
The main differences between wakame and succotash Wakame is richer in folate, manganese, magnesium, calcium, vitamin B2, and vitamin B5, yet succotash is richer in vitamin C, fiber, and vitamin B1. Daily need coverage for folate for wakame is 39% higher. Wakame contains 218 times more sodium than succotash. Wakame contains 872mg of sodium, while succotash contains 4mg. Food types used in this article are Seaweed, wakame, raw and Succotash, (corn and limas), raw .
Infographic
Mineral Comparison
Mineral comparison score is based on the number of minerals by which one or the other food is richer. The "coverage" charts below show how much of the daily needs can be covered by 300 grams of the food.
6
100 g
300 g
2 tbsp (1/8 cup) - 10g
Magnesium
Magnesium
Calcium
Calcium
Potassium
Potassium
Iron
Iron
Copper
Copper
Zinc
Zinc
Phosphorus
Phosphorus
Sodium
Sodium
Manganese
Manganese
Selenium
Selenium
76%
45%
4.4%
82%
95%
10%
34%
114%
183%
3.8%
4
100 g
300 g
Magnesium
Magnesium
Calcium
Calcium
Potassium
Potassium
Iron
Iron
Copper
Copper
Zinc
Zinc
Phosphorus
Phosphorus
Sodium
Sodium
Manganese
Manganese
Selenium
Selenium
34%
5.4%
33%
69%
62%
17%
48%
0.52%
90%
3.3%
Vitamin Comparison
Vitamin comparison score is based on the number of vitamins by which one or the other food is richer. The "coverage" charts below show how much of the daily needs can be covered by 300 grams of the food.
6
100 g
300 g
2 tbsp (1/8 cup) - 10g
Vitamin C
Vit. C
Vitamin D
Vit. D
Vitamin A
Vit. A
Vitamin E
Vit. E
Vitamin B1
Vit. B1
Vitamin B2
Vit. B2
Vitamin B3
Vit. B3
Vitamin B5
Vit. B5
Vitamin B6
Vit. B6
Vitamin B12
Vit. B12
Vitamin K
Vit. K
Folate
Folate
10%
0%
6%
20%
15%
53%
30%
42%
0.46%
0%
13%
147%
3
100 g
300 g
Vitamin C
Vit. C
Vitamin D
Vit. D
Vitamin A
Vit. A
Vitamin E
Vit. E
Vitamin B1
Vit. B1
Vitamin B2
Vit. B2
Vitamin B3
Vit. B3
Vitamin B5
Vit. B5
Vitamin B6
Vit. B6
Vitamin B12
Vit. B12
Vitamin K
Vit. K
Folate
Folate
50%
0%
5%
0%
52%
19%
30%
7.7%
30%
0%
0%
30%
All nutrients comparison - raw data values
Nutrient
DV% diff.
Folate
196µg
40µg
39%
Sodium
872mg
4mg
38%
Manganese
1.4mg
0.688mg
31%
Magnesium
107mg
48mg
14%
Vitamin C
3mg
15.1mg
13%
Calcium
150mg
18mg
13%
Fiber
0.5g
3.8g
13%
Vitamin B1
0.06mg
0.208mg
12%
Copper
0.284mg
0.186mg
11%
Vitamin B2
0.23mg
0.082mg
11%
Vitamin B5
0.697mg
0.128mg
11%
Vitamin B6
0.002mg
0.13mg
10%
Potassium
50mg
369mg
9%
Vitamin E
1mg
7%
Phosphorus
80mg
113mg
5%
Protein
3.03g
5.03g
4%
Iron
2.18mg
1.83mg
4%
Vitamin K
5.3µg
4%
Calories
45kcal
99kcal
3%
Carbs
9.14g
19.59g
3%
Choline
13.9mg
3%
Zinc
0.38mg
0.61mg
2%
Polyunsaturated fat
0.218g
0.489g
2%
Fats
0.64g
1.02g
1%
Protein per 100 calories
6.7g
5.1g
N/A
Calories per 10 g protein
149kcal
197kcal
N/A
Weight per 100 calories
222g
101g
N/A
Net carbs
8.64g
15.79g
N/A
Sugar
0.65g
N/A
Vitamin A
18µg
15µg
0%
Selenium
0.7µg
0.6µg
0%
Vitamin B3
1.6mg
1.587mg
0%
Saturated fat
0.13g
0.19g
0%
Monounsaturated fat
0.058g
0.198g
0%
Tryptophan
0.035mg
0.056mg
0%
Threonine
0.165mg
0.209mg
0%
Isoleucine
0.087mg
0.284mg
0%
Leucine
0.257mg
0.443mg
0%
Lysine
0.112mg
0.295mg
0%
Methionine
0.063mg
0.068mg
0%
Phenylalanine
0.112mg
0.243mg
0%
Valine
0.209mg
0.306mg
0%
Histidine
0.015mg
0.16mg
0%
Omega-3 - EPA
0.186g
N/A
Macronutrient Comparison
Macronutrient breakdown side-by-side comparison
2
3%
9%
80%
7%
Protein:
3.03 g
Fats:
0.64 g
Carbs:
9.14 g
Water:
79.99 g
Other:
7.2 g
3
5%
20%
73%
Protein:
5.03 g
Fats:
1.02 g
Carbs:
19.59 g
Water:
73.1 g
Other:
1.26 g
Contains
more
Other Other
+471.4%
Contains
more
Protein Protein
+66%
Contains
more
Fats Fats
+59.4%
Contains
more
Carbs Carbs
+114.3%
Fat Type Comparison
Fat type breakdown side-by-side comparison
1
32%
14%
54%
Saturated fat:
Sat. Fat
0.13 g
Monounsaturated fat:
Mono. Fat
0.058 g
Polyunsaturated fat:
Poly. Fat
0.218 g
2
22%
23%
56%
Saturated fat:
Sat. Fat
0.19 g
Monounsaturated fat:
Mono. Fat
0.198 g
Polyunsaturated fat:
Poly. Fat
0.489 g
Contains
less
Sat. Fat Saturated fat
-31.6%
Contains
more
Mono. Fat Monounsaturated fat
+241.4%
Contains
more
Poly. Fat Polyunsaturated fat
+124.3%