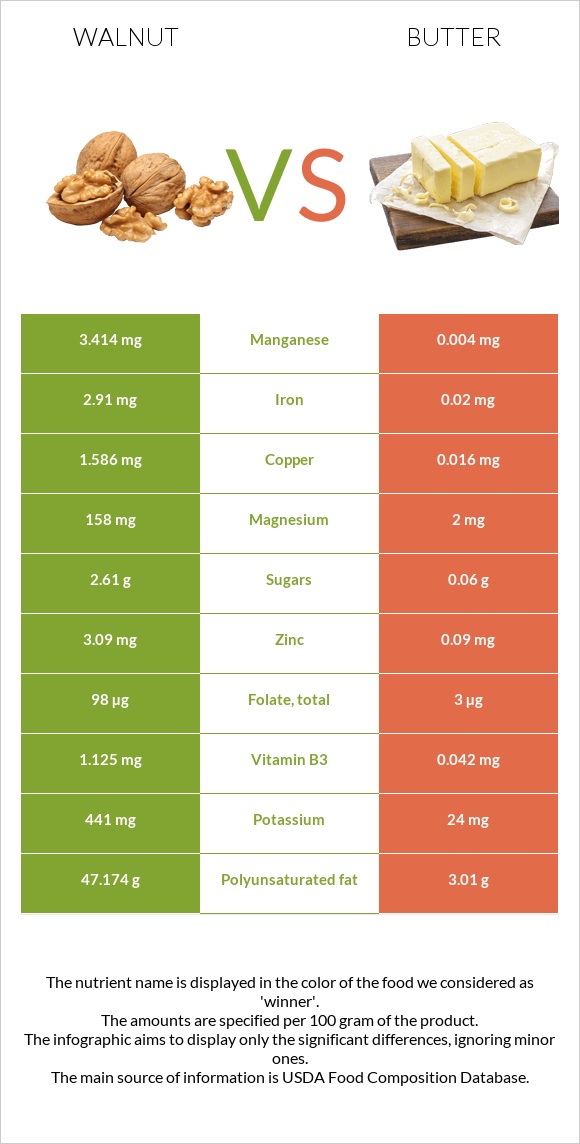
Significant differences between walnut and butter Walnut has more copper, manganese, phosphorus, vitamin B6, magnesium, iron, and vitamin B1; however, butter is richer in vitamin A. Butter covers your daily saturated fat needs 222% more than walnut. Butter has 854 times less manganese than walnut. Walnut has 3.414mg of manganese, while butter has 0.004mg. Walnut contains less saturated fat. Specific food types used in this comparison are Nuts, walnuts, english and Butter, without salt .
Infographic
Mineral Comparison
Mineral comparison score is based on the number of minerals by which one or the other food is richer. The "coverage" charts below show how much of the daily needs can be covered by 300 grams of the food.
10
100 g
300 g
1 cup, in shell, edible yield (7 nuts) - 28g 1 oz (14 halves) - 28.35g 1 cup, ground - 80g 1 cup, chopped - 117g 1 cup pieces or chips - 120g
Magnesium
Magnesium
Calcium
Calcium
Potassium
Potassium
Iron
Iron
Copper
Copper
Zinc
Zinc
Phosphorus
Phosphorus
Sodium
Sodium
Manganese
Manganese
Selenium
Selenium
113%
29%
39%
109%
529%
84%
148%
0.26%
445%
27%
0
100 g
300 g
1 pat (1" sq, 1/3" high) - 5g 1 tbsp - 14.2g 1 stick - 113g 1 cup - 227g
Magnesium
Magnesium
Calcium
Calcium
Potassium
Potassium
Iron
Iron
Copper
Copper
Zinc
Zinc
Phosphorus
Phosphorus
Sodium
Sodium
Manganese
Manganese
Selenium
Selenium
1.4%
7.2%
2.1%
0.75%
5.3%
2.5%
10%
1.4%
0.52%
5.5%
Vitamin Comparison
Vitamin comparison score is based on the number of vitamins by which one or the other food is richer. The "coverage" charts below show how much of the daily needs can be covered by 300 grams of the food.
7
100 g
300 g
1 cup, in shell, edible yield (7 nuts) - 28g 1 oz (14 halves) - 28.35g 1 cup, ground - 80g 1 cup, chopped - 117g 1 cup pieces or chips - 120g
Vitamin C
Vit. C
Vitamin D
Vit. D
Vitamin A
Vit. A
Vitamin E
Vit. E
Vitamin B1
Vit. B1
Vitamin B2
Vit. B2
Vitamin B3
Vit. B3
Vitamin B5
Vit. B5
Vitamin B6
Vit. B6
Vitamin B12
Vit. B12
Vitamin K
Vit. K
Folate
Folate
4.3%
0%
0.33%
14%
85%
35%
21%
34%
124%
0%
6.8%
74%
4
100 g
300 g
1 pat (1" sq, 1/3" high) - 5g 1 tbsp - 14.2g 1 stick - 113g 1 cup - 227g
Vitamin C
Vit. C
Vitamin D
Vit. D
Vitamin A
Vit. A
Vitamin E
Vit. E
Vitamin B1
Vit. B1
Vitamin B2
Vit. B2
Vitamin B3
Vit. B3
Vitamin B5
Vit. B5
Vitamin B6
Vit. B6
Vitamin B12
Vit. B12
Vitamin K
Vit. K
Folate
Folate
0%
0%
228%
46%
1.3%
7.8%
0.79%
6.6%
0.69%
21%
18%
2.3%
All nutrients comparison - raw data values
Nutrient
DV% diff.
Polyunsaturated fat
47.174g
3.01g
294%
Saturated fat
6.126g
50.489g
202%
Copper
1.586mg
0.016mg
174%
Manganese
3.414mg
0.004mg
148%
Vitamin A
1µg
684µg
76%
Cholesterol
0mg
215mg
72%
Phosphorus
346mg
24mg
46%
Vitamin B6
0.537mg
0.003mg
41%
Magnesium
158mg
2mg
37%
Iron
2.91mg
0.02mg
36%
Monounsaturated fat
8.933g
23.43g
36%
Protein
15.23g
0.85g
29%
Vitamin B1
0.341mg
0.005mg
28%
Fiber
6.7g
0g
27%
Zinc
3.09mg
0.09mg
27%
Fats
65.21g
81.11g
24%
Folate
98µg
3µg
24%
Potassium
441mg
24mg
12%
Vitamin E
0.7mg
2.32mg
11%
Vitamin B2
0.15mg
0.034mg
9%
Vitamin B5
0.57mg
0.11mg
9%
Calcium
98mg
24mg
7%
Selenium
4.9µg
1µg
7%
Vitamin B3
1.125mg
0.042mg
7%
Vitamin B12
0µg
0.17µg
7%
Carbs
13.71g
0.06g
5%
Vitamin K
2.7µg
7µg
4%
Choline
39.2mg
18.8mg
4%
Calories
654kcal
717kcal
3%
Vitamin C
1.3mg
0mg
1%
Protein per 100 calories
2.3g
0.12g
N/A
Calories per 10 g protein
429kcal
8435kcal
N/A
Weight per 100 calories
15g
14g
N/A
Unsaturated / Saturated Fat ratio
9.2
0.52
N/A
Net carbs
7.01g
0.06g
N/A
Sugar
2.61g
0.06g
N/A
Starch
0.06g
0%
Sodium
2mg
11mg
0%
Tryptophan
0.17mg
0.012mg
0%
Threonine
0.596mg
0.038mg
0%
Isoleucine
0.625mg
0.051mg
0%
Leucine
1.17mg
0.083mg
0%
Lysine
0.424mg
0.067mg
0%
Methionine
0.236mg
0.021mg
0%
Phenylalanine
0.711mg
0.041mg
0%
Valine
0.753mg
0.057mg
0%
Histidine
0.391mg
0.023mg
0%
Fructose
0.09g
0%
Omega-3 - ALA
0.315g
N/A
Omega-6 - Linoleic acid
2.166g
N/A
Macronutrient Comparison
Macronutrient breakdown side-by-side comparison
3
15%
65%
14%
4%
2%
Protein:
15.23 g
Fats:
65.21 g
Carbs:
13.71 g
Water:
4.07 g
Other:
1.78 g
2
81%
18%
Protein:
0.85 g
Fats:
81.11 g
Carbs:
0.06 g
Water:
17.94 g
Other:
0.04 g
Contains
more
Protein Protein
+1691.8%
Contains
more
Carbs Carbs
+22750%
Contains
more
Other Other
+4350%
Contains
more
Fats Fats
+24.4%
Contains
more
Water Water
+340.8%
Fat Type Comparison
Fat type breakdown side-by-side comparison
2
10%
14%
76%
Saturated fat:
Sat. Fat
6.126 g
Monounsaturated fat:
Mono. Fat
8.933 g
Polyunsaturated fat:
Poly. Fat
47.174 g
1
66%
30%
4%
Saturated fat:
Sat. Fat
50.489 g
Monounsaturated fat:
Mono. Fat
23.43 g
Polyunsaturated fat:
Poly. Fat
3.01 g
Contains
less
Sat. Fat Saturated fat
-87.9%
Contains
more
Poly. Fat Polyunsaturated fat
+1467.2%
Contains
more
Mono. Fat Monounsaturated fat
+162.3%