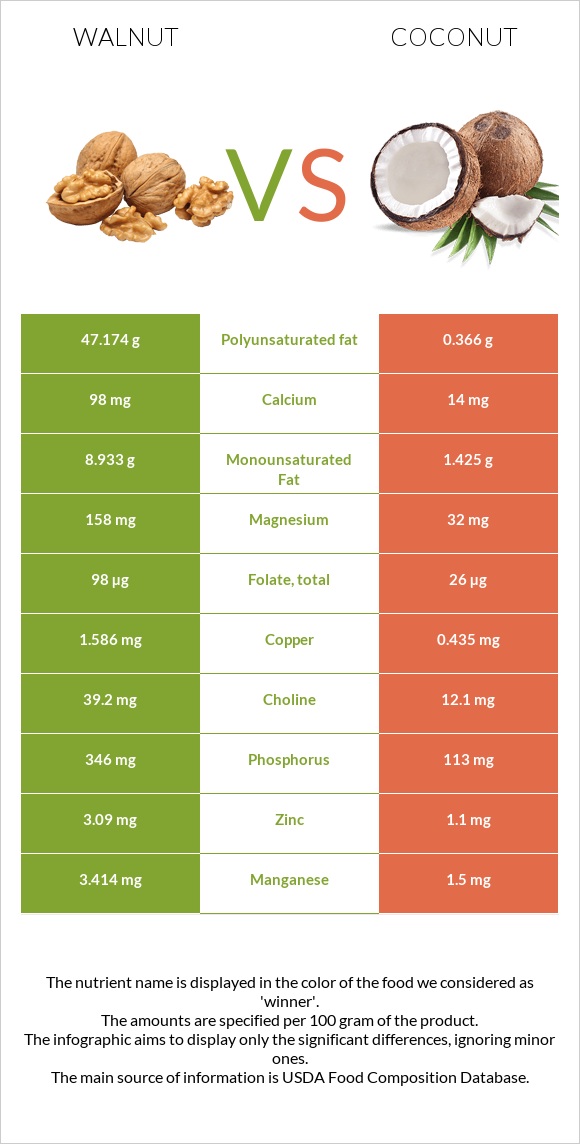
How are walnut and coconut different? Walnut has more copper, manganese, vitamin B6, phosphorus, magnesium, vitamin B1, zinc, folate, and vitamin B2 than coconut. Daily need coverage for copper for walnut is 128% higher. Walnut contains 10 times more vitamin B6 than coconut. While walnut contains 0.537mg of vitamin B6, coconut contains only 0.054mg. Walnut has less saturated fat. Walnut has a lower glycemic index (0) than coconut (59). Nuts, walnuts, english and Nuts, coconut meat, raw are the varieties used in this article.
Infographic
Mineral Comparison
Mineral comparison score is based on the number of minerals by which one or the other food is richer. The "coverage" charts below show how much of the daily needs can be covered by 300 grams of the food.
9
100 g
300 g
1 cup, in shell, edible yield (7 nuts) - 28g 1 oz (14 halves) - 28.35g 1 cup, ground - 80g 1 cup, chopped - 117g 1 cup pieces or chips - 120g
Magnesium
Magnesium
Calcium
Calcium
Potassium
Potassium
Iron
Iron
Copper
Copper
Zinc
Zinc
Phosphorus
Phosphorus
Sodium
Sodium
Manganese
Manganese
Selenium
Selenium
113%
29%
39%
109%
529%
84%
148%
0.26%
445%
27%
1
100 g
300 g
1 piece (2" x 2" x 1/2") - 45g 1 cup, shredded - 80g 1 medium - 397g
Magnesium
Magnesium
Calcium
Calcium
Potassium
Potassium
Iron
Iron
Copper
Copper
Zinc
Zinc
Phosphorus
Phosphorus
Sodium
Sodium
Manganese
Manganese
Selenium
Selenium
23%
4.2%
31%
91%
145%
30%
48%
2.6%
196%
55%
Vitamin Comparison
Vitamin comparison score is based on the number of vitamins by which one or the other food is richer. The "coverage" charts below show how much of the daily needs can be covered by 300 grams of the food.
9
100 g
300 g
1 cup, in shell, edible yield (7 nuts) - 28g 1 oz (14 halves) - 28.35g 1 cup, ground - 80g 1 cup, chopped - 117g 1 cup pieces or chips - 120g
Vitamin C
Vit. C
Vitamin D
Vit. D
Vitamin A
Vit. A
Vitamin E
Vit. E
Vitamin B1
Vit. B1
Vitamin B2
Vit. B2
Vitamin B3
Vit. B3
Vitamin B5
Vit. B5
Vitamin B6
Vit. B6
Vitamin B12
Vit. B12
Vitamin K
Vit. K
Folate
Folate
4.3%
0%
0.33%
14%
85%
35%
21%
34%
124%
0%
6.8%
74%
1
100 g
300 g
1 piece (2" x 2" x 1/2") - 45g 1 cup, shredded - 80g 1 medium - 397g
Vitamin C
Vit. C
Vitamin D
Vit. D
Vitamin A
Vit. A
Vitamin E
Vit. E
Vitamin B1
Vit. B1
Vitamin B2
Vit. B2
Vitamin B3
Vit. B3
Vitamin B5
Vit. B5
Vitamin B6
Vit. B6
Vitamin B12
Vit. B12
Vitamin K
Vit. K
Folate
Folate
11%
0%
0%
4.8%
17%
4.6%
10%
18%
12%
0%
0.5%
20%
All nutrients comparison - raw data values
Nutrient
DV% diff.
Polyunsaturated fat
47.174g
0.366g
312%
Copper
1.586mg
0.435mg
128%
Saturated fat
6.126g
29.698g
107%
Manganese
3.414mg
1.5mg
83%
Fats
65.21g
33.49g
49%
Vitamin B6
0.537mg
0.054mg
37%
Phosphorus
346mg
113mg
33%
Magnesium
158mg
32mg
30%
Protein
15.23g
3.33g
24%
Vitamin B1
0.341mg
0.066mg
23%
Monounsaturated fat
8.933g
1.425g
19%
Zinc
3.09mg
1.1mg
18%
Folate
98µg
26µg
18%
Calories
654kcal
354kcal
15%
Vitamin B2
0.15mg
0.02mg
10%
Fiber
6.7g
9g
9%
Selenium
4.9µg
10.1µg
9%
Calcium
98mg
14mg
8%
Iron
2.91mg
2.43mg
6%
Vitamin B5
0.57mg
0.3mg
5%
Choline
39.2mg
12.1mg
5%
Vitamin B3
1.125mg
0.54mg
4%
Potassium
441mg
356mg
3%
Vitamin E
0.7mg
0.24mg
3%
Vitamin C
1.3mg
3.3mg
2%
Vitamin K
2.7µg
0.2µg
2%
Carbs
13.71g
15.23g
1%
Sodium
2mg
20mg
1%
Protein per 100 calories
2.3g
0.94g
N/A
Calories per 10 g protein
429kcal
1063kcal
N/A
Weight per 100 calories
15g
28g
N/A
Unsaturated / Saturated Fat ratio
9.2
0.06
N/A
Net carbs
7.01g
6.23g
N/A
Sugar
2.61g
6.23g
N/A
Starch
0.06g
0%
Vitamin A
1µg
0µg
0%
Tryptophan
0.17mg
0.039mg
0%
Threonine
0.596mg
0.121mg
0%
Isoleucine
0.625mg
0.131mg
0%
Leucine
1.17mg
0.247mg
0%
Lysine
0.424mg
0.147mg
0%
Methionine
0.236mg
0.062mg
0%
Phenylalanine
0.711mg
0.169mg
0%
Valine
0.753mg
0.202mg
0%
Histidine
0.391mg
0.077mg
0%
Fructose
0.09g
0%
Macronutrient Comparison
Macronutrient breakdown side-by-side comparison
3
15%
65%
14%
4%
2%
Protein:
15.23 g
Fats:
65.21 g
Carbs:
13.71 g
Water:
4.07 g
Other:
1.78 g
2
3%
33%
15%
47%
Protein:
3.33 g
Fats:
33.49 g
Carbs:
15.23 g
Water:
46.99 g
Other:
0.96 g
Contains
more
Protein Protein
+357.4%
Contains
more
Fats Fats
+94.7%
Contains
more
Other Other
+85.4%
Contains
more
Carbs Carbs
+11.1%
Contains
more
Water Water
+1054.5%
Fat Type Comparison
Fat type breakdown side-by-side comparison
3
10%
14%
76%
Saturated fat:
Sat. Fat
6.126 g
Monounsaturated fat:
Mono. Fat
8.933 g
Polyunsaturated fat:
Poly. Fat
47.174 g
0
94%
5%
Saturated fat:
Sat. Fat
29.698 g
Monounsaturated fat:
Mono. Fat
1.425 g
Polyunsaturated fat:
Poly. Fat
0.366 g
Contains
less
Sat. Fat Saturated fat
-79.4%
Contains
more
Mono. Fat Monounsaturated fat
+526.9%
Contains
more
Poly. Fat Polyunsaturated fat
+12789.1%