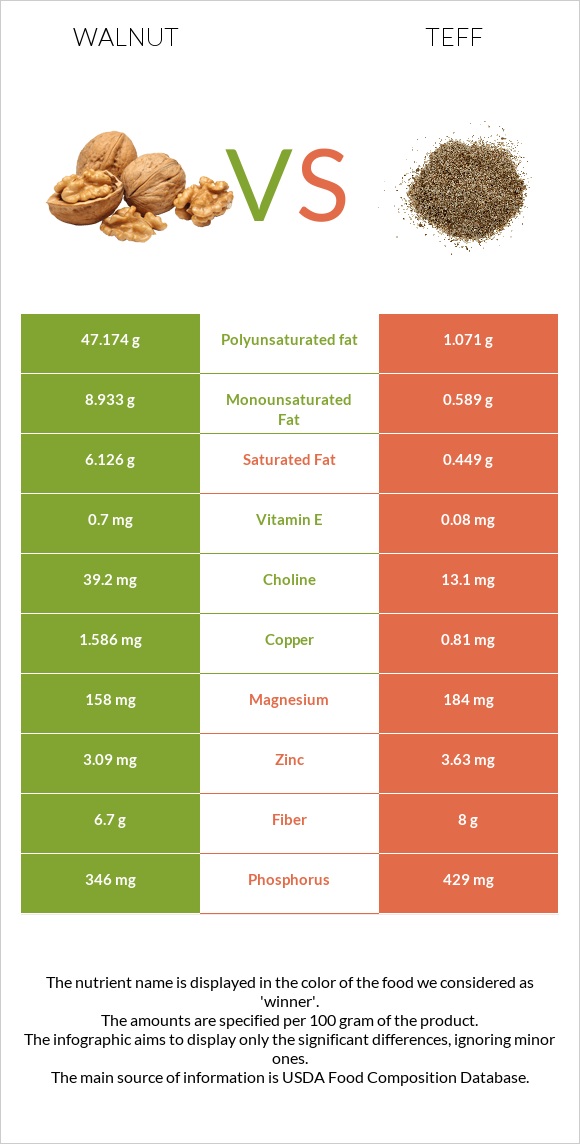
What are the differences between walnut and teff? Walnut is higher in copper, yet teff is higher in manganese, iron, vitamin B3, phosphorus, vitamin B2, calcium, vitamin B5, and magnesium. Teff's daily need coverage for manganese is 253% more. Walnut has 14 times more saturated fat than teff. While walnut has 6.126g of saturated fat, teff has only 0.449g. We used Nuts, walnuts, english and Teff, uncooked types in this article.
Infographic
Mineral Comparison
Mineral comparison score is based on the number of minerals by which one or the other food is richer. The "coverage" charts below show how much of the daily needs can be covered by 300 grams of the food.
3
100 g
300 g
1 cup, in shell, edible yield (7 nuts) - 28g 1 oz (14 halves) - 28.35g 1 cup, ground - 80g 1 cup, chopped - 117g 1 cup pieces or chips - 120g
Magnesium
Magnesium
Calcium
Calcium
Potassium
Potassium
Iron
Iron
Copper
Copper
Zinc
Zinc
Phosphorus
Phosphorus
Sodium
Sodium
Manganese
Manganese
Selenium
Selenium
113%
29%
39%
109%
529%
84%
148%
0.26%
445%
27%
6
100 g
300 g
1 cup - 193g
Magnesium
Magnesium
Calcium
Calcium
Potassium
Potassium
Iron
Iron
Copper
Copper
Zinc
Zinc
Phosphorus
Phosphorus
Sodium
Sodium
Manganese
Manganese
Selenium
Selenium
131%
54%
38%
286%
270%
99%
184%
1.6%
1205%
24%
Vitamin Comparison
Vitamin comparison score is based on the number of vitamins by which one or the other food is richer. The "coverage" charts below show how much of the daily needs can be covered by 300 grams of the food.
6
100 g
300 g
1 cup, in shell, edible yield (7 nuts) - 28g 1 oz (14 halves) - 28.35g 1 cup, ground - 80g 1 cup, chopped - 117g 1 cup pieces or chips - 120g
Vitamin C
Vit. C
Vitamin D
Vit. D
Vitamin A
Vit. A
Vitamin E
Vit. E
Vitamin B1
Vit. B1
Vitamin B2
Vit. B2
Vitamin B3
Vit. B3
Vitamin B5
Vit. B5
Vitamin B6
Vit. B6
Vitamin B12
Vit. B12
Vitamin K
Vit. K
Folate
Folate
4.3%
0%
0.33%
14%
85%
35%
21%
34%
124%
0%
6.8%
74%
4
100 g
300 g
1 cup - 193g
Vitamin C
Vit. C
Vitamin D
Vit. D
Vitamin A
Vit. A
Vitamin E
Vit. E
Vitamin B1
Vit. B1
Vitamin B2
Vit. B2
Vitamin B3
Vit. B3
Vitamin B5
Vit. B5
Vitamin B6
Vit. B6
Vitamin B12
Vit. B12
Vitamin K
Vit. K
Folate
Folate
0%
0%
0%
1.6%
98%
62%
63%
57%
111%
0%
4.8%
0%
All nutrients comparison - raw data values
Nutrient
DV% diff.
Polyunsaturated fat
47.174g
1.071g
307%
Manganese
3.414mg
9.24mg
253%
Fats
65.21g
2.38g
97%
Copper
1.586mg
0.81mg
86%
Iron
2.91mg
7.63mg
59%
Saturated fat
6.126g
0.449g
26%
Folate
98µg
25%
Monounsaturated fat
8.933g
0.589g
21%
Carbs
13.71g
73.13g
20%
Starch
0.06g
36.56g
15%
Calories
654kcal
367kcal
14%
Vitamin B3
1.125mg
3.363mg
14%
Phosphorus
346mg
429mg
12%
Vitamin B2
0.15mg
0.27mg
9%
Calcium
98mg
180mg
8%
Vitamin B5
0.57mg
0.942mg
7%
Magnesium
158mg
184mg
6%
Fiber
6.7g
8g
5%
Zinc
3.09mg
3.63mg
5%
Choline
39.2mg
13.1mg
5%
Protein
15.23g
13.3g
4%
Vitamin E
0.7mg
0.08mg
4%
Vitamin B1
0.341mg
0.39mg
4%
Vitamin B6
0.537mg
0.482mg
4%
Vitamin C
1.3mg
1%
Selenium
4.9µg
4.4µg
1%
Vitamin K
2.7µg
1.9µg
1%
Protein per 100 calories
2.3g
3.6g
N/A
Calories per 10 g protein
429kcal
276kcal
N/A
Weight per 100 calories
15g
27g
N/A
Unsaturated / Saturated Fat ratio
9.2
3.7
N/A
Net carbs
7.01g
65.13g
N/A
Potassium
441mg
427mg
0%
Sugar
2.61g
1.84g
N/A
Sodium
2mg
12mg
0%
Vitamin A
1µg
0µg
0%
Tryptophan
0.17mg
0.139mg
0%
Threonine
0.596mg
0.51mg
0%
Isoleucine
0.625mg
0.501mg
0%
Leucine
1.17mg
1.068mg
0%
Lysine
0.424mg
0.376mg
0%
Methionine
0.236mg
0.428mg
0%
Phenylalanine
0.711mg
0.698mg
0%
Valine
0.753mg
0.686mg
0%
Histidine
0.391mg
0.301mg
0%
Fructose
0.09g
0.47g
0%
Omega-3 - ALA
0.135g
N/A
Macronutrient Comparison
Macronutrient breakdown side-by-side comparison
2
15%
65%
14%
4%
2%
Protein:
15.23 g
Fats:
65.21 g
Carbs:
13.71 g
Water:
4.07 g
Other:
1.78 g
3
13%
2%
73%
9%
2%
Protein:
13.3 g
Fats:
2.38 g
Carbs:
73.13 g
Water:
8.82 g
Other:
2.37 g
Contains
more
Protein Protein
+14.5%
Contains
more
Fats Fats
+2639.9%
Contains
more
Carbs Carbs
+433.4%
Contains
more
Water Water
+116.7%
Contains
more
Other Other
+33.1%
Fat Type Comparison
Fat type breakdown side-by-side comparison
2
10%
14%
76%
Saturated fat:
Sat. Fat
6.126 g
Monounsaturated fat:
Mono. Fat
8.933 g
Polyunsaturated fat:
Poly. Fat
47.174 g
1
21%
28%
51%
Saturated fat:
Sat. Fat
0.449 g
Monounsaturated fat:
Mono. Fat
0.589 g
Polyunsaturated fat:
Poly. Fat
1.071 g
Contains
more
Mono. Fat Monounsaturated fat
+1416.6%
Contains
more
Poly. Fat Polyunsaturated fat
+4304.7%
Contains
less
Sat. Fat Saturated fat
-92.7%
Carbohydrate type comparison
Carbohydrate type breakdown side-by-side comparison
1
2%
91%
3%
3%
Starch:
0.06 g
Sucrose:
2.43 g
Glucose:
0.08 g
Fructose:
0.09 g
Lactose:
0 g
Maltose:
0 g
Galactose:
0 g
4
95%
2%
Starch:
36.56 g
Sucrose:
0.62 g
Glucose:
0.73 g
Fructose:
0.47 g
Lactose:
0 g
Maltose:
0.01 g
Galactose:
0 g
Contains
more
Sucrose Sucrose
+291.9%
Contains
more
Starch Starch
+60833.3%
Contains
more
Glucose Glucose
+812.5%
Contains
more
Fructose Fructose
+422.2%
Contains
more
Maltose Maltose
+∞%
~equal in
Lactose
~0g
~equal in
Galactose
~0g