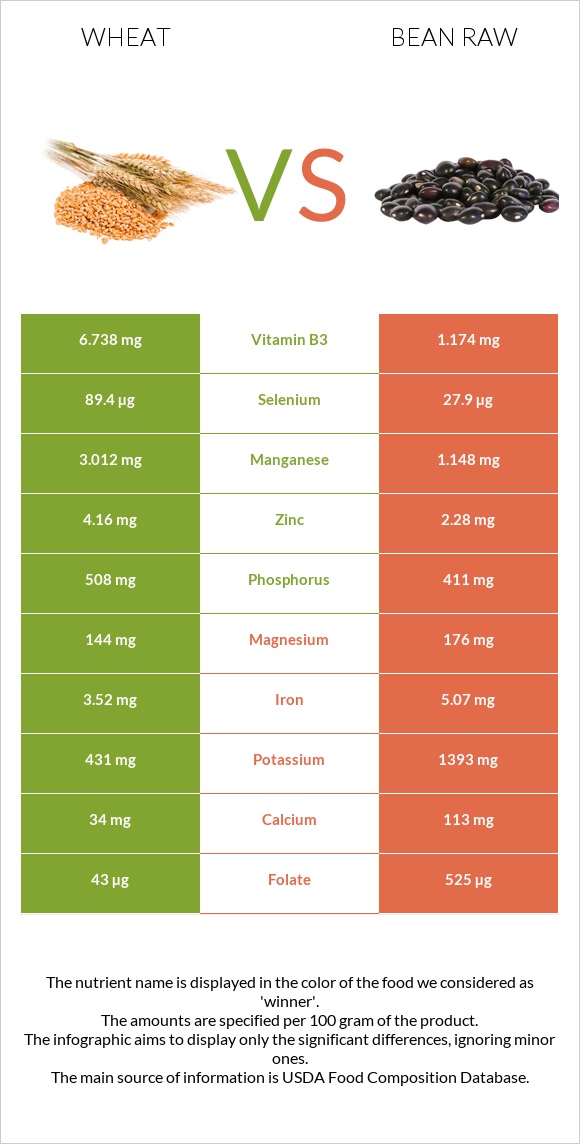
How are wheat and bean raw different? Wheat is richer in selenium, manganese, vitamin B3, zinc, and phosphorus, while bean raw is higher in folate, copper, potassium, vitamin B1, and iron. Bean raw covers your daily need for folate, 121% more than wheat . Wheat contains 6 times more vitamin B3 than bean raw. Wheat contains 6.738mg of vitamin B3, while bean raw contains 1.174mg. Wheat has a higher glycemic index (50) than bean raw (33). Wheat, durum and Beans, pinto, mature seeds, raw types were used in this article.
Infographic
Mineral Comparison
Mineral comparison score is based on the number of minerals by which one or the other food is richer. The "coverage" charts below show how much of the daily needs can be covered by 300 grams of the food.
5
100 g
300 g
1 cup - 192g
Magnesium
Magnesium
Calcium
Calcium
Potassium
Potassium
Iron
Iron
Copper
Copper
Zinc
Zinc
Phosphorus
Phosphorus
Sodium
Sodium
Manganese
Manganese
Selenium
Selenium
103%
10%
38%
132%
184%
113%
218%
0.26%
393%
488%
5
100 g
300 g
1 tbsp - 12g 1 cup - 193g
Magnesium
Magnesium
Calcium
Calcium
Potassium
Potassium
Iron
Iron
Copper
Copper
Zinc
Zinc
Phosphorus
Phosphorus
Sodium
Sodium
Manganese
Manganese
Selenium
Selenium
126%
34%
123%
190%
298%
62%
176%
1.6%
150%
152%
Vitamin Comparison
Vitamin comparison score is based on the number of vitamins by which one or the other food is richer. The "coverage" charts below show how much of the daily needs can be covered by 300 grams of the food.
2
100 g
300 g
1 cup - 192g
Vitamin C
Vit. C
Vitamin D
Vit. D
Vitamin A
Vit. A
Vitamin E
Vit. E
Vitamin B1
Vit. B1
Vitamin B2
Vit. B2
Vitamin B3
Vit. B3
Vitamin B5
Vit. B5
Vitamin B6
Vit. B6
Vitamin B12
Vit. B12
Vitamin K
Vit. K
Folate
Folate
0%
0%
0%
0%
105%
28%
126%
56%
97%
0%
0%
32%
7
100 g
300 g
1 tbsp - 12g 1 cup - 193g
Vitamin C
Vit. C
Vitamin D
Vit. D
Vitamin A
Vit. A
Vitamin E
Vit. E
Vitamin B1
Vit. B1
Vitamin B2
Vit. B2
Vitamin B3
Vit. B3
Vitamin B5
Vit. B5
Vitamin B6
Vit. B6
Vitamin B12
Vit. B12
Vitamin K
Vit. K
Folate
Folate
21%
0%
0%
4.2%
178%
49%
22%
47%
109%
0%
14%
394%
All nutrients comparison - raw data values
Nutrient
DV% diff.
Folate
43µg
525µg
121%
Selenium
89.4µg
27.9µg
112%
Manganese
3.012mg
1.148mg
81%
Fiber
15.5g
62%
Copper
0.553mg
0.893mg
38%
Vitamin B3
6.738mg
1.174mg
35%
Potassium
431mg
1393mg
28%
Vitamin B1
0.419mg
0.713mg
25%
Iron
3.52mg
5.07mg
19%
Zinc
4.16mg
2.28mg
17%
Protein
13.68g
21.42g
15%
Starch
34.17g
14%
Phosphorus
508mg
411mg
14%
Choline
66.2mg
12%
Magnesium
144mg
176mg
8%
Calcium
34mg
113mg
8%
Vitamin C
0mg
6.3mg
7%
Vitamin B2
0.121mg
0.212mg
7%
Vitamin K
5.6µg
5%
Vitamin B6
0.419mg
0.474mg
4%
Polyunsaturated fat
0.978g
0.407g
4%
Carbs
71.13g
62.55g
3%
Vitamin B5
0.935mg
0.785mg
3%
Fats
2.47g
1.23g
2%
Vitamin E
0.21mg
1%
Saturated fat
0.454g
0.235g
1%
Calories
339kcal
347kcal
0%
Protein per 100 calories
4g
6.2g
N/A
Calories per 10 g protein
248kcal
162kcal
N/A
Weight per 100 calories
29g
29g
N/A
Unsaturated / Saturated Fat ratio
2.9
2.7
N/A
Net carbs
71.13g
47.05g
N/A
Sugar
2.11g
N/A
Sodium
2mg
12mg
0%
Monounsaturated fat
0.344g
0.229g
0%
Tryptophan
0.176mg
0.237mg
0%
Threonine
0.366mg
0.81mg
0%
Isoleucine
0.533mg
0.871mg
0%
Leucine
0.934mg
1.558mg
0%
Lysine
0.303mg
1.356mg
0%
Methionine
0.221mg
0.259mg
0%
Phenylalanine
0.681mg
1.095mg
0%
Valine
0.594mg
0.998mg
0%
Histidine
0.322mg
0.556mg
0%
Macronutrient Comparison
Macronutrient breakdown side-by-side comparison
2
14%
2%
71%
11%
2%
Protein:
13.68 g
Fats:
2.47 g
Carbs:
71.13 g
Water:
10.94 g
Other:
1.78 g
3
21%
63%
11%
3%
Protein:
21.42 g
Fats:
1.23 g
Carbs:
62.55 g
Water:
11.33 g
Other:
3.47 g
Contains
more
Fats Fats
+100.8%
Contains
more
Carbs Carbs
+13.7%
Contains
more
Protein Protein
+56.6%
Contains
more
Other Other
+94.9%
Fat Type Comparison
Fat type breakdown side-by-side comparison
2
26%
19%
55%
Saturated fat:
Sat. Fat
0.454 g
Monounsaturated fat:
Mono. Fat
0.344 g
Polyunsaturated fat:
Poly. Fat
0.978 g
1
27%
26%
47%
Saturated fat:
Sat. Fat
0.235 g
Monounsaturated fat:
Mono. Fat
0.229 g
Polyunsaturated fat:
Poly. Fat
0.407 g
Contains
more
Mono. Fat Monounsaturated fat
+50.2%
Contains
more
Poly. Fat Polyunsaturated fat
+140.3%
Contains
less
Sat. Fat Saturated fat
-48.2%