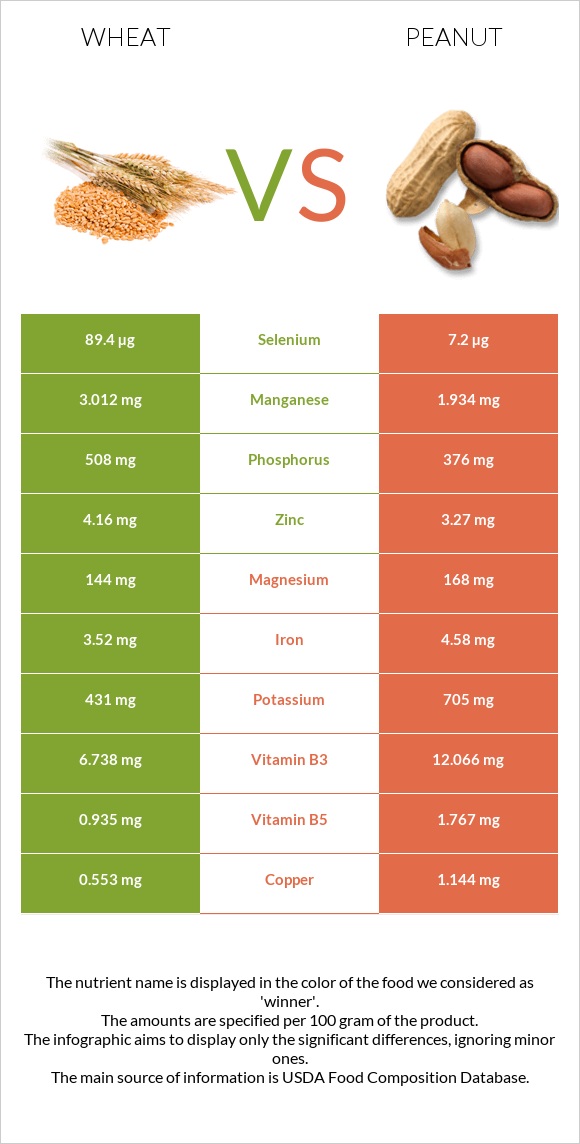
Summary of differences between wheat and peanuts Wheat has more selenium, manganese, and phosphorus; however, peanuts are higher in copper, folate, vitamin B3, vitamin B1, vitamin B5, and iron. Wheat covers your daily need for selenium, 149% more than peanuts. Wheat has 2 times more manganese than peanuts. While wheat has 3.012mg of manganese, peanuts have only 1.934mg. Wheat has less saturated fat. The glycemic index of wheat is higher. These are the specific foods used in this comparison Wheat, durum and Peanuts, all types, raw .
Infographic
Mineral Comparison
Mineral comparison score is based on the number of minerals by which one or the other food is richer. The "coverage" charts below show how much of the daily needs can be covered by 300 grams of the food.
5
100 g
300 g
1 cup - 192g
Magnesium
Magnesium
Calcium
Calcium
Potassium
Potassium
Iron
Iron
Copper
Copper
Zinc
Zinc
Phosphorus
Phosphorus
Sodium
Sodium
Manganese
Manganese
Selenium
Selenium
103%
10%
38%
132%
184%
113%
218%
0.26%
393%
488%
5
100 g
300 g
1 oz - 28.35g 1 cup - 146g
Magnesium
Magnesium
Calcium
Calcium
Potassium
Potassium
Iron
Iron
Copper
Copper
Zinc
Zinc
Phosphorus
Phosphorus
Sodium
Sodium
Manganese
Manganese
Selenium
Selenium
120%
28%
62%
172%
381%
89%
161%
2.3%
252%
39%
Vitamin Comparison
Vitamin comparison score is based on the number of vitamins by which one or the other food is richer. The "coverage" charts below show how much of the daily needs can be covered by 300 grams of the food.
1
100 g
300 g
1 cup - 192g
Vitamin C
Vit. C
Vitamin D
Vit. D
Vitamin A
Vit. A
Vitamin E
Vit. E
Vitamin B1
Vit. B1
Vitamin B2
Vit. B2
Vitamin B3
Vit. B3
Vitamin B5
Vit. B5
Vitamin B6
Vit. B6
Vitamin B12
Vit. B12
Vitamin K
Vit. K
Folate
Folate
0%
0%
0%
0%
105%
28%
126%
56%
97%
0%
0%
32%
6
100 g
300 g
1 oz - 28.35g 1 cup - 146g
Vitamin C
Vit. C
Vitamin D
Vit. D
Vitamin A
Vit. A
Vitamin E
Vit. E
Vitamin B1
Vit. B1
Vitamin B2
Vit. B2
Vitamin B3
Vit. B3
Vitamin B5
Vit. B5
Vitamin B6
Vit. B6
Vitamin B12
Vit. B12
Vitamin K
Vit. K
Folate
Folate
0%
0%
0%
167%
160%
31%
226%
106%
80%
0%
0%
180%
All nutrients comparison - raw data values
Nutrient
DV% diff.
Selenium
89.4µg
7.2µg
149%
Polyunsaturated fat
0.978g
15.558g
97%
Fats
2.47g
49.24g
72%
Copper
0.553mg
1.144mg
66%
Monounsaturated fat
0.344g
24.426g
60%
Vitamin E
8.33mg
56%
Folate
43µg
240µg
49%
Manganese
3.012mg
1.934mg
47%
Fiber
8.5g
34%
Vitamin B3
6.738mg
12.066mg
33%
Saturated fat
0.454g
6.279g
26%
Protein
13.68g
25.8g
24%
Phosphorus
508mg
376mg
19%
Carbs
71.13g
16.13g
18%
Vitamin B1
0.419mg
0.64mg
18%
Vitamin B5
0.935mg
1.767mg
17%
Iron
3.52mg
4.58mg
13%
Calories
339kcal
567kcal
11%
Choline
52.5mg
10%
Potassium
431mg
705mg
8%
Zinc
4.16mg
3.27mg
8%
Magnesium
144mg
168mg
6%
Calcium
34mg
92mg
6%
Vitamin B6
0.419mg
0.348mg
5%
Sodium
2mg
18mg
1%
Vitamin B2
0.121mg
0.135mg
1%
Protein per 100 calories
4g
4.6g
N/A
Calories per 10 g protein
248kcal
220kcal
N/A
Weight per 100 calories
29g
18g
N/A
Unsaturated / Saturated Fat ratio
2.9
6.4
N/A
Net carbs
71.13g
7.63g
N/A
Sugar
4.72g
N/A
Tryptophan
0.176mg
0.25mg
0%
Threonine
0.366mg
0.883mg
0%
Isoleucine
0.533mg
0.907mg
0%
Leucine
0.934mg
1.672mg
0%
Lysine
0.303mg
0.926mg
0%
Methionine
0.221mg
0.317mg
0%
Phenylalanine
0.681mg
1.377mg
0%
Valine
0.594mg
1.082mg
0%
Histidine
0.322mg
0.652mg
0%
Macronutrient Comparison
Macronutrient breakdown side-by-side comparison
2
14%
2%
71%
11%
2%
Protein:
13.68 g
Fats:
2.47 g
Carbs:
71.13 g
Water:
10.94 g
Other:
1.78 g
3
26%
49%
16%
7%
2%
Protein:
25.8 g
Fats:
49.24 g
Carbs:
16.13 g
Water:
6.5 g
Other:
2.33 g
Contains
more
Carbs Carbs
+341%
Contains
more
Water Water
+68.3%
Contains
more
Protein Protein
+88.6%
Contains
more
Fats Fats
+1893.5%
Contains
more
Other Other
+30.9%
Fat Type Comparison
Fat type breakdown side-by-side comparison
1
26%
19%
55%
Saturated fat:
Sat. Fat
0.454 g
Monounsaturated fat:
Mono. Fat
0.344 g
Polyunsaturated fat:
Poly. Fat
0.978 g
2
14%
53%
34%
Saturated fat:
Sat. Fat
6.279 g
Monounsaturated fat:
Mono. Fat
24.426 g
Polyunsaturated fat:
Poly. Fat
15.558 g
Contains
less
Sat. Fat Saturated fat
-92.8%
Contains
more
Mono. Fat Monounsaturated fat
+7000.6%
Contains
more
Poly. Fat Polyunsaturated fat
+1490.8%