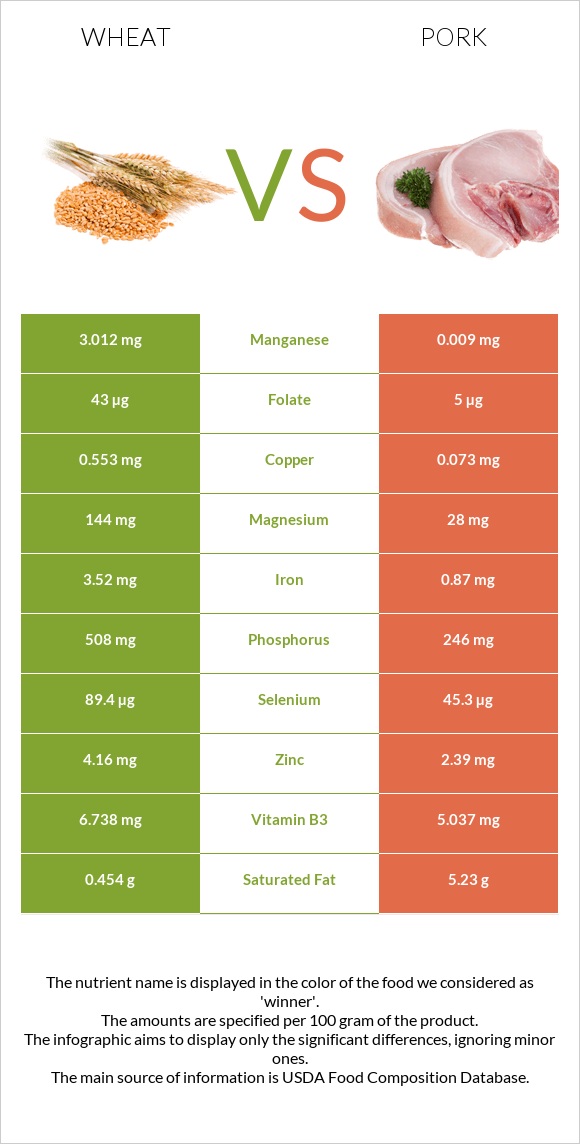
How are wheat and pork different? Wheat is richer in manganese, selenium, copper, phosphorus, iron, and magnesium, while pork is higher in vitamin B1 and vitamin B12. Wheat covers your daily need for manganese, 131% more than pork. Wheat contains 8 times more copper than pork. Wheat contains 0.553mg of copper, while pork contains 0.073mg. Wheat is lower in saturated fat. Wheat has a higher glycemic index (50) than pork (0). Wheat, durum and Pork, fresh, loin, whole, separable lean, and fat, cooked, broiled types were used in this article.
Infographic
Mineral Comparison
Mineral comparison score is based on the number of minerals by which one or the other food is richer. The "coverage" charts below show how much of the daily needs can be covered by 300 grams of the food.
9
100 g
300 g
1 cup - 192g
Magnesium
Magnesium
Calcium
Calcium
Potassium
Potassium
Iron
Iron
Copper
Copper
Zinc
Zinc
Phosphorus
Phosphorus
Sodium
Sodium
Manganese
Manganese
Selenium
Selenium
103%
10%
38%
132%
184%
113%
218%
0.26%
393%
488%
0
100 g
300 g
3 oz - 85g 1 chop, excluding refuse (yield from 1 raw chop, with refuse, weighing 151 g) - 87g
Magnesium
Magnesium
Calcium
Calcium
Potassium
Potassium
Iron
Iron
Copper
Copper
Zinc
Zinc
Phosphorus
Phosphorus
Sodium
Sodium
Manganese
Manganese
Selenium
Selenium
20%
5.7%
37%
33%
24%
65%
105%
8.1%
1.2%
247%
Vitamin Comparison
Vitamin comparison score is based on the number of vitamins by which one or the other food is richer. The "coverage" charts below show how much of the daily needs can be covered by 300 grams of the food.
3
100 g
300 g
1 cup - 192g
Vitamin C
Vit. C
Vitamin D
Vit. D
Vitamin A
Vit. A
Vitamin E
Vit. E
Vitamin B1
Vit. B1
Vitamin B2
Vit. B2
Vitamin B3
Vit. B3
Vitamin B5
Vit. B5
Vitamin B6
Vit. B6
Vitamin B12
Vit. B12
Vitamin K
Vit. K
Folate
Folate
0%
0%
0%
0%
105%
28%
126%
56%
97%
0%
0%
32%
8
100 g
300 g
3 oz - 85g 1 chop, excluding refuse (yield from 1 raw chop, with refuse, weighing 151 g) - 87g
Vitamin C
Vit. C
Vitamin D
Vit. D
Vitamin A
Vit. A
Vitamin E
Vit. E
Vitamin B1
Vit. B1
Vitamin B2
Vit. B2
Vitamin B3
Vit. B3
Vitamin B5
Vit. B5
Vitamin B6
Vit. B6
Vitamin B12
Vit. B12
Vitamin K
Vit. K
Folate
Folate
2%
20%
0.67%
5.8%
219%
74%
94%
42%
107%
88%
0%
3.8%
All nutrients comparison - raw data values
Nutrient
DV% diff.
Manganese
3.012mg
0.009mg
131%
Selenium
89.4µg
45.3µg
80%
Copper
0.553mg
0.073mg
53%
Vitamin B1
0.419mg
0.877mg
38%
Phosphorus
508mg
246mg
37%
Iron
3.52mg
0.87mg
33%
Vitamin B12
0µg
0.7µg
29%
Magnesium
144mg
28mg
28%
Protein
13.68g
27.32g
27%
Cholesterol
0mg
80mg
27%
Carbs
71.13g
0g
24%
Saturated fat
0.454g
5.23g
22%
Fats
2.47g
13.92g
18%
Choline
93.9mg
17%
Zinc
4.16mg
2.39mg
16%
Vitamin B2
0.121mg
0.321mg
15%
Monounsaturated fat
0.344g
6.19g
15%
Vitamin B3
6.738mg
5.037mg
11%
Folate
43µg
5µg
10%
Vitamin D*
0 IU
53 IU
7%
Vitamin D
0µg
1.3µg
7%
Calories
339kcal
242kcal
5%
Vitamin B5
0.935mg
0.698mg
5%
Sodium
2mg
62mg
3%
Vitamin B6
0.419mg
0.464mg
3%
Calcium
34mg
19mg
2%
Vitamin E
0.29mg
2%
Vitamin C
0mg
0.6mg
1%
Polyunsaturated fat
0.978g
1.2g
1%
Protein per 100 calories
4g
11g
N/A
Calories per 10 g protein
248kcal
89kcal
N/A
Weight per 100 calories
29g
41g
N/A
Unsaturated / Saturated Fat ratio
2.9
1.4
N/A
Net carbs
71.13g
0g
N/A
Potassium
431mg
423mg
0%
Vitamin A
0µg
2µg
0%
Tryptophan
0.176mg
0.338mg
0%
Threonine
0.366mg
1.234mg
0%
Isoleucine
0.533mg
1.26mg
0%
Leucine
0.934mg
2.177mg
0%
Lysine
0.303mg
2.446mg
0%
Methionine
0.221mg
0.712mg
0%
Phenylalanine
0.681mg
1.086mg
0%
Valine
0.594mg
1.473mg
0%
Histidine
0.322mg
1.067mg
0%
Macronutrient Comparison
Macronutrient breakdown side-by-side comparison
2
14%
2%
71%
11%
2%
Protein:
13.68 g
Fats:
2.47 g
Carbs:
71.13 g
Water:
10.94 g
Other:
1.78 g
3
27%
14%
58%
Protein:
27.32 g
Fats:
13.92 g
Carbs:
0 g
Water:
57.87 g
Other:
0.89 g
Contains
more
Carbs Carbs
+∞%
Contains
more
Other Other
+100%
Contains
more
Protein Protein
+99.7%
Contains
more
Fats Fats
+463.6%
Contains
more
Water Water
+429%
Fat Type Comparison
Fat type breakdown side-by-side comparison
1
26%
19%
55%
Saturated fat:
Sat. Fat
0.454 g
Monounsaturated fat:
Mono. Fat
0.344 g
Polyunsaturated fat:
Poly. Fat
0.978 g
2
41%
49%
10%
Saturated fat:
Sat. Fat
5.23 g
Monounsaturated fat:
Mono. Fat
6.19 g
Polyunsaturated fat:
Poly. Fat
1.2 g
Contains
less
Sat. Fat Saturated fat
-91.3%
Contains
more
Mono. Fat Monounsaturated fat
+1699.4%
Contains
more
Poly. Fat Polyunsaturated fat
+22.7%