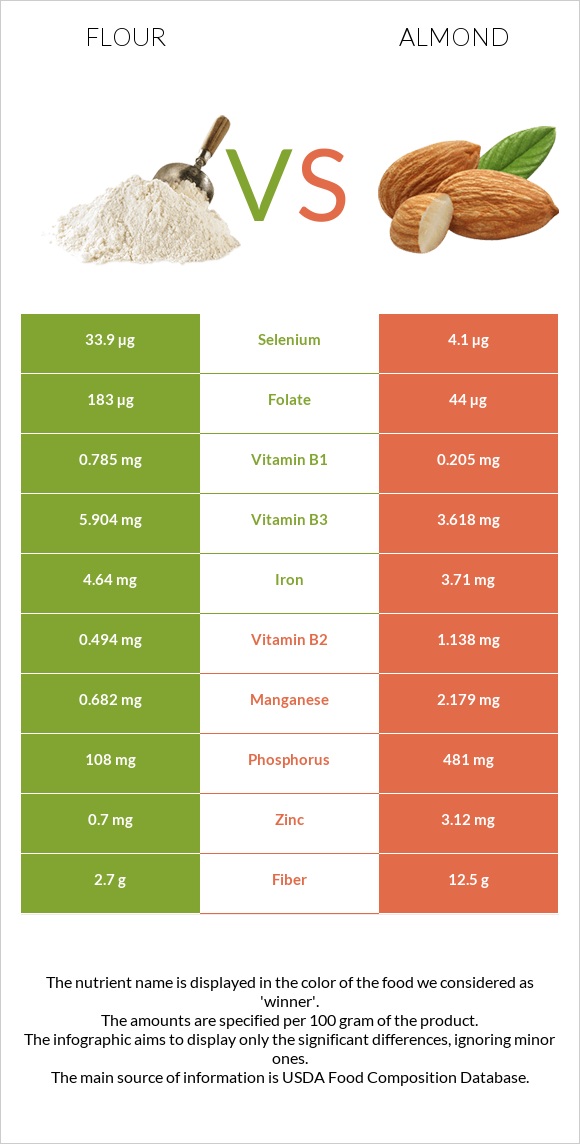
Important differences between flour and almonds Flour has more selenium, vitamin B1, and folate; however, almonds are richer in vitamin E, copper, manganese, magnesium, phosphorus, vitamin B2, and fiber. Almonds' daily need coverage for vitamin E is 170% more. Flour contains 8 times more selenium than almonds. Flour contains 33.9µg of selenium, while almonds contain 4.1µg. Flour has a higher glycemic index. The glycemic index of flour is 72, while the glycemic index of almonds is 0. The food varieties used in the comparison are Wheat flour, white, all-purpose, enriched, bleached and Nuts, almonds .
Infographic
Mineral Comparison
Mineral comparison score is based on the number of minerals by which one or the other food is richer. The "coverage" charts below show how much of the daily needs can be covered by 300 grams of the food.
2
100 g
300 g
1 cup - 125g
Magnesium
Magnesium
Calcium
Calcium
Potassium
Potassium
Iron
Iron
Copper
Copper
Zinc
Zinc
Phosphorus
Phosphorus
Sodium
Sodium
Manganese
Manganese
Selenium
Selenium
16%
4.5%
9.4%
174%
48%
19%
46%
0.26%
89%
185%
8
100 g
300 g
1 almond - 1.2g 1 oz (23 whole kernels) - 28.35g 1 cup, sliced - 92g 1 cup, ground - 95g 1 cup, slivered - 108g 1 cup, whole - 143g
Magnesium
Magnesium
Calcium
Calcium
Potassium
Potassium
Iron
Iron
Copper
Copper
Zinc
Zinc
Phosphorus
Phosphorus
Sodium
Sodium
Manganese
Manganese
Selenium
Selenium
193%
81%
65%
139%
344%
85%
206%
0.13%
284%
22%
Vitamin Comparison
Vitamin comparison score is based on the number of vitamins by which one or the other food is richer. The "coverage" charts below show how much of the daily needs can be covered by 300 grams of the food.
4
100 g
300 g
1 cup - 125g
Vitamin C
Vit. C
Vitamin D
Vit. D
Vitamin A
Vit. A
Vitamin E
Vit. E
Vitamin B1
Vit. B1
Vitamin B2
Vit. B2
Vitamin B3
Vit. B3
Vitamin B5
Vit. B5
Vitamin B6
Vit. B6
Vitamin B12
Vit. B12
Vitamin K
Vit. K
Folate
Folate
0%
0%
0%
1.2%
196%
114%
111%
26%
10%
0%
0.75%
137%
3
100 g
300 g
1 almond - 1.2g 1 oz (23 whole kernels) - 28.35g 1 cup, sliced - 92g 1 cup, ground - 95g 1 cup, slivered - 108g 1 cup, whole - 143g
Vitamin C
Vit. C
Vitamin D
Vit. D
Vitamin A
Vit. A
Vitamin E
Vit. E
Vitamin B1
Vit. B1
Vitamin B2
Vit. B2
Vitamin B3
Vit. B3
Vitamin B5
Vit. B5
Vitamin B6
Vit. B6
Vitamin B12
Vit. B12
Vitamin K
Vit. K
Folate
Folate
0%
0%
0%
513%
51%
263%
68%
28%
32%
0%
0%
33%
All nutrients comparison - raw data values
Nutrient
DV% diff.
Vitamin E
0.06mg
25.63mg
170%
Copper
0.144mg
1.031mg
99%
Monounsaturated fat
0.087g
31.551g
79%
Polyunsaturated fat
0.413g
12.329g
79%
Fats
0.98g
49.93g
75%
Manganese
0.682mg
2.179mg
65%
Magnesium
22mg
270mg
59%
Selenium
33.9µg
4.1µg
54%
Phosphorus
108mg
481mg
53%
Vitamin B2
0.494mg
1.138mg
50%
Vitamin B1
0.785mg
0.205mg
48%
Fiber
2.7g
12.5g
39%
Folate
183µg
44µg
35%
Calcium
15mg
269mg
25%
Protein
10.33g
21.15g
22%
Zinc
0.7mg
3.12mg
22%
Carbs
76.31g
21.55g
18%
Potassium
107mg
733mg
18%
Saturated fat
0.155g
3.802g
17%
Vitamin B3
5.904mg
3.618mg
14%
Iron
4.64mg
3.71mg
12%
Calories
364kcal
579kcal
11%
Choline
10.4mg
52.1mg
8%
Vitamin B6
0.044mg
0.137mg
7%
Vitamin B5
0.438mg
0.471mg
1%
Protein per 100 calories
2.8g
3.7g
N/A
Calories per 10 g protein
352kcal
274kcal
N/A
Weight per 100 calories
27g
17g
N/A
Unsaturated / Saturated Fat ratio
3.2
12
N/A
Net carbs
73.61g
9.05g
N/A
Sugar
0.27g
4.35g
N/A
Starch
0.72g
0%
Sodium
2mg
1mg
0%
Vitamin K
0.3µg
0µg
0%
Trans fat
0.015g
N/A
Tryptophan
0.127mg
0.211mg
0%
Threonine
0.281mg
0.601mg
0%
Isoleucine
0.357mg
0.751mg
0%
Leucine
0.71mg
1.473mg
0%
Lysine
0.228mg
0.568mg
0%
Methionine
0.183mg
0.157mg
0%
Phenylalanine
0.52mg
1.132mg
0%
Valine
0.415mg
0.855mg
0%
Histidine
0.23mg
0.539mg
0%
Fructose
0.11g
0%
Omega-3 - ALA
0.003g
N/A
Omega-6 - Eicosadienoic acid
0.002g
N/A
Omega-6 - Linoleic acid
12.32g
N/A
Macronutrient Comparison
Macronutrient breakdown side-by-side comparison
2
10%
76%
12%
Protein:
10.33 g
Fats:
0.98 g
Carbs:
76.31 g
Water:
11.92 g
Other:
0.46 g
3
21%
50%
22%
4%
3%
Protein:
21.15 g
Fats:
49.93 g
Carbs:
21.55 g
Water:
4.41 g
Other:
2.96 g
Contains
more
Carbs Carbs
+254.1%
Contains
more
Water Water
+170.3%
Contains
more
Protein Protein
+104.7%
Contains
more
Fats Fats
+4994.9%
Contains
more
Other Other
+543.5%
Fat Type Comparison
Fat type breakdown side-by-side comparison
1
24%
13%
63%
Saturated fat:
Sat. Fat
0.155 g
Monounsaturated fat:
Mono. Fat
0.087 g
Polyunsaturated fat:
Poly. Fat
0.413 g
2
8%
66%
26%
Saturated fat:
Sat. Fat
3.802 g
Monounsaturated fat:
Mono. Fat
31.551 g
Polyunsaturated fat:
Poly. Fat
12.329 g
Contains
less
Sat. Fat Saturated fat
-95.9%
Contains
more
Mono. Fat Monounsaturated fat
+36165.5%
Contains
more
Poly. Fat Polyunsaturated fat
+2885.2%