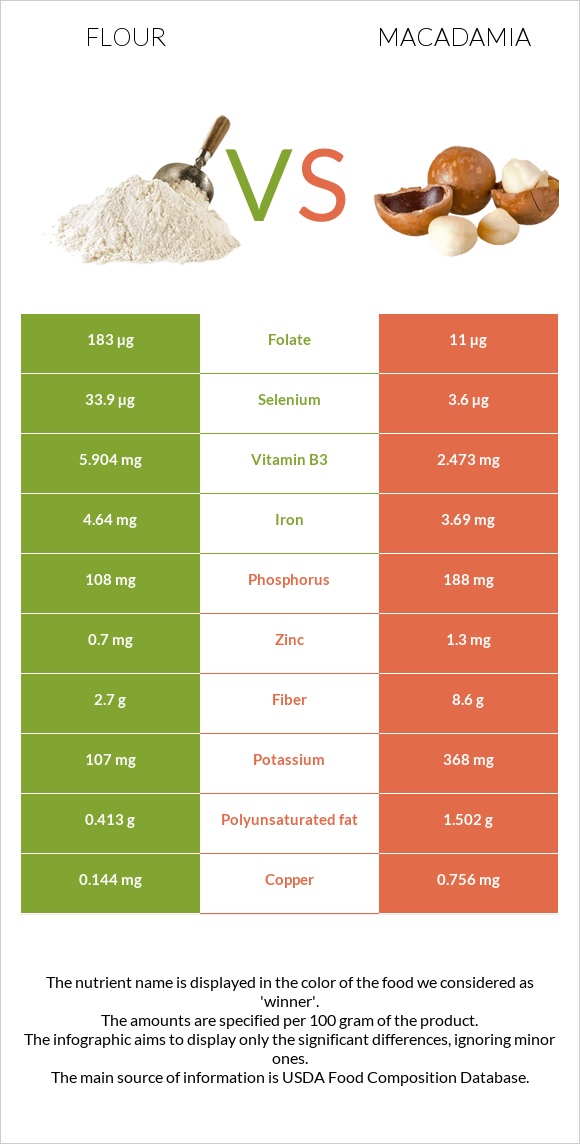
Important differences between flour and macadamia Flour has more selenium, folate, vitamin B2, and vitamin B3; however, macadamia is richer in manganese, copper, vitamin B1, magnesium, and fiber. Macadamia's daily need coverage for manganese is 150% more. Flour contains 17 times more folate than macadamia. Flour contains 183µg of folate, while macadamia contains 11µg. Flour contains less saturated fat. Flour has a higher glycemic index. The glycemic index of flour is 72, while the glycemic index of macadamia is 10. The food varieties used in the comparison are Wheat flour, white, all-purpose, enriched, bleached and Nuts, macadamia nuts, raw .
Infographic
Mineral Comparison
Mineral comparison score is based on the number of minerals by which one or the other food is richer. The "coverage" charts below show how much of the daily needs can be covered by 300 grams of the food.
3
100 g
300 g
1 cup - 125g
Magnesium
Magnesium
Calcium
Calcium
Potassium
Potassium
Iron
Iron
Copper
Copper
Zinc
Zinc
Phosphorus
Phosphorus
Sodium
Sodium
Manganese
Manganese
Selenium
Selenium
16%
4.5%
9.4%
174%
48%
19%
46%
0.26%
89%
185%
7
100 g
300 g
1 oz (10-12 kernels) - 28.35g 1 cup, whole or halves - 134g
Magnesium
Magnesium
Calcium
Calcium
Potassium
Potassium
Iron
Iron
Copper
Copper
Zinc
Zinc
Phosphorus
Phosphorus
Sodium
Sodium
Manganese
Manganese
Selenium
Selenium
93%
26%
32%
138%
252%
35%
81%
0.65%
539%
20%
Vitamin Comparison
Vitamin comparison score is based on the number of vitamins by which one or the other food is richer. The "coverage" charts below show how much of the daily needs can be covered by 300 grams of the food.
4
100 g
300 g
1 cup - 125g
Vitamin C
Vit. C
Vitamin D
Vit. D
Vitamin A
Vit. A
Vitamin E
Vit. E
Vitamin B1
Vit. B1
Vitamin B2
Vit. B2
Vitamin B3
Vit. B3
Vitamin B5
Vit. B5
Vitamin B6
Vit. B6
Vitamin B12
Vit. B12
Vitamin K
Vit. K
Folate
Folate
0%
0%
0%
1.2%
196%
114%
111%
26%
10%
0%
0.75%
137%
5
100 g
300 g
1 oz (10-12 kernels) - 28.35g 1 cup, whole or halves - 134g
Vitamin C
Vit. C
Vitamin D
Vit. D
Vitamin A
Vit. A
Vitamin E
Vit. E
Vitamin B1
Vit. B1
Vitamin B2
Vit. B2
Vitamin B3
Vit. B3
Vitamin B5
Vit. B5
Vitamin B6
Vit. B6
Vitamin B12
Vit. B12
Vitamin K
Vit. K
Folate
Folate
4%
0%
0%
11%
299%
37%
46%
45%
63%
0%
0%
8.3%
All nutrients comparison - raw data values
Nutrient
DV% diff.
Manganese
0.682mg
4.131mg
150%
Monounsaturated fat
0.087g
58.877g
147%
Fats
0.98g
75.77g
115%
Copper
0.144mg
0.756mg
68%
Selenium
33.9µg
3.6µg
55%
Saturated fat
0.155g
12.061g
54%
Folate
183µg
11µg
43%
Vitamin B1
0.785mg
1.195mg
34%
Magnesium
22mg
130mg
26%
Vitamin B2
0.494mg
0.162mg
26%
Fiber
2.7g
8.6g
24%
Carbs
76.31g
13.82g
21%
Vitamin B3
5.904mg
2.473mg
21%
Calories
364kcal
718kcal
18%
Vitamin B6
0.044mg
0.275mg
18%
Iron
4.64mg
3.69mg
12%
Phosphorus
108mg
188mg
11%
Potassium
107mg
368mg
8%
Calcium
15mg
85mg
7%
Polyunsaturated fat
0.413g
1.502g
7%
Vitamin B5
0.438mg
0.758mg
6%
Protein
10.33g
7.91g
5%
Zinc
0.7mg
1.3mg
5%
Vitamin E
0.06mg
0.54mg
3%
Choline
10.4mg
2%
Vitamin C
0mg
1.2mg
1%
Protein per 100 calories
2.8g
1.1g
N/A
Calories per 10 g protein
352kcal
908kcal
N/A
Weight per 100 calories
27g
14g
N/A
Unsaturated / Saturated Fat ratio
3.2
5
N/A
Net carbs
73.61g
5.22g
N/A
Sugar
0.27g
4.57g
N/A
Starch
1.05g
0%
Sodium
2mg
5mg
0%
Vitamin K
0.3µg
0%
Tryptophan
0.127mg
0.067mg
0%
Threonine
0.281mg
0.37mg
0%
Isoleucine
0.357mg
0.314mg
0%
Leucine
0.71mg
0.602mg
0%
Lysine
0.228mg
0.018mg
0%
Methionine
0.183mg
0.023mg
0%
Phenylalanine
0.52mg
0.665mg
0%
Valine
0.415mg
0.363mg
0%
Histidine
0.23mg
0.195mg
0%
Fructose
0.07g
0%
Macronutrient Comparison
Macronutrient breakdown side-by-side comparison
3
10%
76%
12%
Protein:
10.33 g
Fats:
0.98 g
Carbs:
76.31 g
Water:
11.92 g
Other:
0.46 g
2
8%
76%
14%
Protein:
7.91 g
Fats:
75.77 g
Carbs:
13.82 g
Water:
1.36 g
Other:
1.14 g
Contains
more
Protein Protein
+30.6%
Contains
more
Carbs Carbs
+452.2%
Contains
more
Water Water
+776.5%
Contains
more
Fats Fats
+7631.6%
Contains
more
Other Other
+147.8%
Fat Type Comparison
Fat type breakdown side-by-side comparison
1
24%
13%
63%
Saturated fat:
Sat. Fat
0.155 g
Monounsaturated fat:
Mono. Fat
0.087 g
Polyunsaturated fat:
Poly. Fat
0.413 g
2
17%
81%
2%
Saturated fat:
Sat. Fat
12.061 g
Monounsaturated fat:
Mono. Fat
58.877 g
Polyunsaturated fat:
Poly. Fat
1.502 g
Contains
less
Sat. Fat Saturated fat
-98.7%
Contains
more
Mono. Fat Monounsaturated fat
+67574.7%
Contains
more
Poly. Fat Polyunsaturated fat
+263.7%