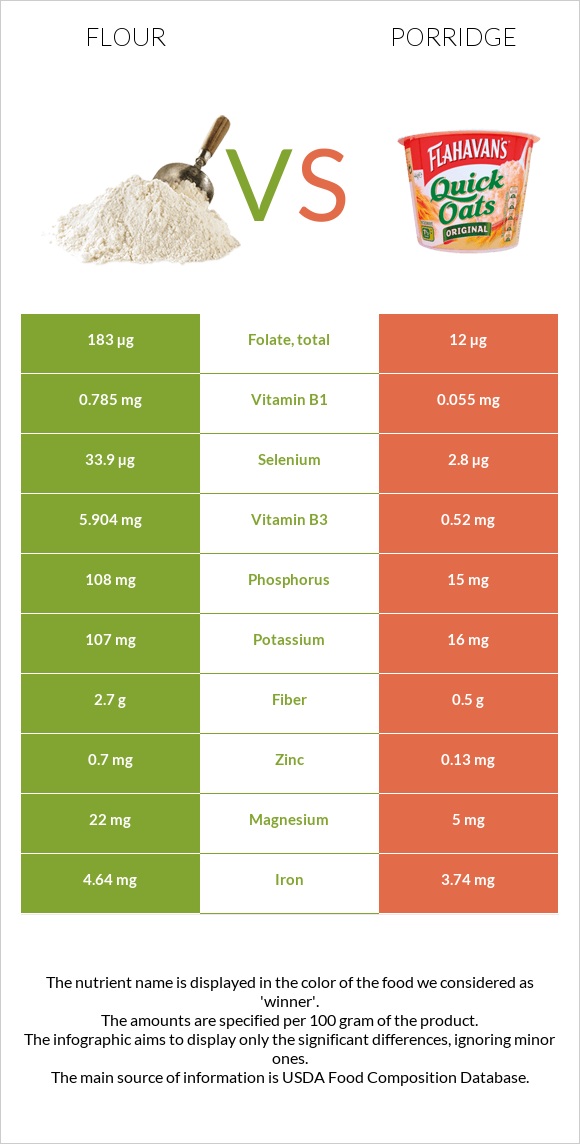
The main differences between flour and porridge Porridge contains less vitamin B1, selenium, folate, vitamin B2, vitamin B3, manganese, phosphorus, copper, iron, and fiber than flour. Daily need coverage for vitamin B1 for flour is 61% higher. Food types used in this article are Wheat flour, white, all-purpose, enriched, bleached and Cereals, CREAM OF WHEAT, regular (10 minute), cooked with water, without salt .
Infographic
Mineral Comparison
Mineral comparison score is based on the number of minerals by which one or the other food is richer. The "coverage" charts below show how much of the daily needs can be covered by 300 grams of the food.
9
100 g
300 g
1 cup - 125g
Magnesium
Magnesium
Calcium
Calcium
Potassium
Potassium
Iron
Iron
Copper
Copper
Zinc
Zinc
Phosphorus
Phosphorus
Sodium
Sodium
Manganese
Manganese
Selenium
Selenium
16%
4.5%
9.4%
174%
48%
19%
46%
0.26%
89%
185%
1
100 g
300 g
1 tbsp - 16g 1 cup (1 serving) - 251g
Magnesium
Magnesium
Calcium
Calcium
Potassium
Potassium
Iron
Iron
Copper
Copper
Zinc
Zinc
Phosphorus
Phosphorus
Sodium
Sodium
Manganese
Manganese
Selenium
Selenium
3.6%
26%
1.4%
140%
13%
3.5%
6.4%
0.78%
0%
15%
Vitamin Comparison
Vitamin comparison score is based on the number of vitamins by which one or the other food is richer. The "coverage" charts below show how much of the daily needs can be covered by 300 grams of the food.
8
100 g
300 g
1 cup - 125g
Vitamin C
Vit. C
Vitamin D
Vit. D
Vitamin A
Vit. A
Vitamin E
Vit. E
Vitamin B1
Vit. B1
Vitamin B2
Vit. B2
Vitamin B3
Vit. B3
Vitamin B5
Vit. B5
Vitamin B6
Vit. B6
Vitamin B12
Vit. B12
Vitamin K
Vit. K
Folate
Folate
0%
0%
0%
1.2%
196%
114%
111%
26%
10%
0%
0.75%
137%
0
100 g
300 g
1 tbsp - 16g 1 cup (1 serving) - 251g
Vitamin C
Vit. C
Vitamin D
Vit. D
Vitamin A
Vit. A
Vitamin E
Vit. E
Vitamin B1
Vit. B1
Vitamin B2
Vit. B2
Vitamin B3
Vit. B3
Vitamin B5
Vit. B5
Vitamin B6
Vit. B6
Vitamin B12
Vit. B12
Vitamin K
Vit. K
Folate
Folate
0%
0%
0%
0.4%
14%
5.8%
9.8%
4.3%
3%
0%
0.25%
9%
All nutrients comparison - raw data values
Nutrient
DV% diff.
Vitamin B1
0.785mg
0.055mg
61%
Selenium
33.9µg
2.8µg
57%
Folate
183µg
12µg
43%
Vitamin B2
0.494mg
0.025mg
36%
Vitamin B3
5.904mg
0.52mg
34%
Manganese
0.682mg
0mg
30%
Carbs
76.31g
10.52g
22%
Protein
10.33g
1.44g
18%
Calories
364kcal
50kcal
16%
Phosphorus
108mg
15mg
13%
Copper
0.144mg
0.04mg
12%
Iron
4.64mg
3.74mg
11%
Fiber
2.7g
0.5g
9%
Calcium
15mg
87mg
7%
Vitamin B5
0.438mg
0.071mg
7%
Zinc
0.7mg
0.13mg
5%
Magnesium
22mg
5mg
4%
Potassium
107mg
16mg
3%
Vitamin B6
0.044mg
0.013mg
2%
Choline
10.4mg
2%
Polyunsaturated fat
0.413g
0.114g
2%
Fats
0.98g
0.21g
1%
Saturated fat
0.155g
0.033g
1%
Protein per 100 calories
2.8g
2.9g
N/A
Calories per 10 g protein
352kcal
347kcal
N/A
Weight per 100 calories
27g
200g
N/A
Net carbs
73.61g
10.02g
N/A
Sugar
0.27g
0.03g
N/A
Sodium
2mg
6mg
0%
Vitamin E
0.06mg
0.02mg
0%
Vitamin K
0.3µg
0.1µg
0%
Monounsaturated fat
0.087g
0.028g
0%
Tryptophan
0.127mg
0.02mg
0%
Threonine
0.281mg
0.045mg
0%
Isoleucine
0.357mg
0.063mg
0%
Leucine
0.71mg
0.11mg
0%
Lysine
0.228mg
0.037mg
0%
Methionine
0.183mg
0.027mg
0%
Phenylalanine
0.52mg
0.078mg
0%
Valine
0.415mg
0.07mg
0%
Histidine
0.23mg
0.033mg
0%
Macronutrient Comparison
Macronutrient breakdown side-by-side comparison
4
10%
76%
12%
Protein:
10.33 g
Fats:
0.98 g
Carbs:
76.31 g
Water:
11.92 g
Other:
0.46 g
1
11%
88%
Protein:
1.44 g
Fats:
0.21 g
Carbs:
10.52 g
Water:
87.61 g
Other:
0.22 g
Contains
more
Protein Protein
+617.4%
Contains
more
Fats Fats
+366.7%
Contains
more
Carbs Carbs
+625.4%
Contains
more
Other Other
+109.1%
Contains
more
Water Water
+635%
Fat Type Comparison
Fat type breakdown side-by-side comparison
2
24%
13%
63%
Saturated fat:
Sat. Fat
0.155 g
Monounsaturated fat:
Mono. Fat
0.087 g
Polyunsaturated fat:
Poly. Fat
0.413 g
1
19%
16%
65%
Saturated fat:
Sat. Fat
0.033 g
Monounsaturated fat:
Mono. Fat
0.028 g
Polyunsaturated fat:
Poly. Fat
0.114 g
Contains
more
Mono. Fat Monounsaturated fat
+210.7%
Contains
more
Poly. Fat Polyunsaturated fat
+262.3%
Contains
less
Sat. Fat Saturated fat
-78.7%