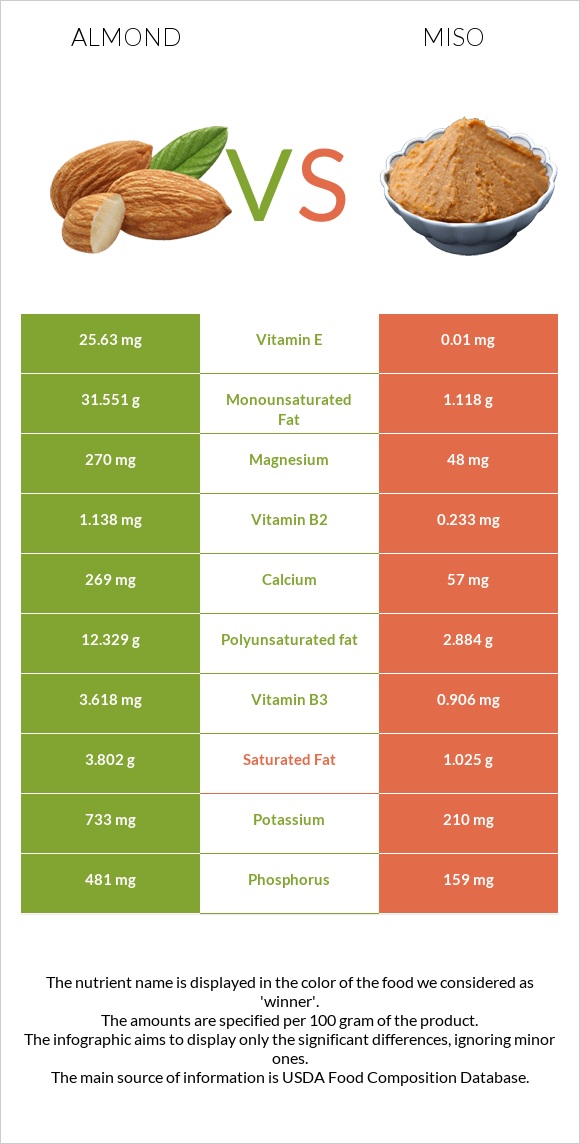
Summary of differences between almonds and miso Almonds have more vitamin E, vitamin B2, copper, manganese, magnesium, phosphorus, fiber, and calcium, while miso has more vitamin K. Almonds cover your daily need for vitamin E, 171% more than miso. Almonds contain 6 times more magnesium than miso. While almonds contain 270mg of magnesium, miso contains only 48mg. The amount of sodium in almonds is lower. Almonds have a lower glycemic index. The glycemic index of almonds is 0, while the glycemic index of miso is 61. These are the specific foods used in this comparison Nuts, almonds and Miso .
Infographic
Mineral Comparison
Mineral comparison score is based on the number of minerals by which one or the other food is richer. The "coverage" charts below show how much of the daily needs can be covered by 300 grams of the food.
9
100 g
300 g
1 almond - 1.2g 1 oz (23 whole kernels) - 28.35g 1 cup, sliced - 92g 1 cup, ground - 95g 1 cup, slivered - 108g 1 cup, whole - 143g
Magnesium
Magnesium
Calcium
Calcium
Potassium
Potassium
Iron
Iron
Copper
Copper
Zinc
Zinc
Phosphorus
Phosphorus
Sodium
Sodium
Manganese
Manganese
Selenium
Selenium
193%
81%
65%
139%
344%
85%
206%
0.13%
284%
22%
1
100 g
300 g
1 tbsp - 17g 1 cup - 275g
Magnesium
Magnesium
Calcium
Calcium
Potassium
Potassium
Iron
Iron
Copper
Copper
Zinc
Zinc
Phosphorus
Phosphorus
Sodium
Sodium
Manganese
Manganese
Selenium
Selenium
34%
17%
19%
93%
140%
70%
68%
486%
112%
38%
Vitamin Comparison
Vitamin comparison score is based on the number of vitamins by which one or the other food is richer. The "coverage" charts below show how much of the daily needs can be covered by 300 grams of the food.
6
100 g
300 g
1 almond - 1.2g 1 oz (23 whole kernels) - 28.35g 1 cup, sliced - 92g 1 cup, ground - 95g 1 cup, slivered - 108g 1 cup, whole - 143g
Vitamin C
Vit. C
Vitamin D
Vit. D
Vitamin A
Vit. A
Vitamin E
Vit. E
Vitamin B1
Vit. B1
Vitamin B2
Vit. B2
Vitamin B3
Vit. B3
Vitamin B5
Vit. B5
Vitamin B6
Vit. B6
Vitamin B12
Vit. B12
Vitamin K
Vit. K
Folate
Folate
0%
0%
0%
513%
51%
263%
68%
28%
32%
0%
0%
33%
4
100 g
300 g
1 tbsp - 17g 1 cup - 275g
Vitamin C
Vit. C
Vitamin D
Vit. D
Vitamin A
Vit. A
Vitamin E
Vit. E
Vitamin B1
Vit. B1
Vitamin B2
Vit. B2
Vitamin B3
Vit. B3
Vitamin B5
Vit. B5
Vitamin B6
Vit. B6
Vitamin B12
Vit. B12
Vitamin K
Vit. K
Folate
Folate
0%
0%
1.3%
0.2%
25%
54%
17%
20%
46%
10%
73%
14%
All nutrients comparison - raw data values
Nutrient
DV% diff.
Vitamin E
25.63mg
0.01mg
171%
Sodium
1mg
3728mg
162%
Monounsaturated fat
31.551g
1.118g
76%
Vitamin B2
1.138mg
0.233mg
70%
Fats
49.93g
6.01g
68%
Copper
1.031mg
0.42mg
68%
Polyunsaturated fat
12.329g
2.884g
63%
Manganese
2.179mg
0.859mg
57%
Magnesium
270mg
48mg
53%
Phosphorus
481mg
159mg
46%
Fiber
12.5g
5.4g
28%
Vitamin K
0µg
29.3µg
24%
Calcium
269mg
57mg
21%
Calories
579kcal
198kcal
19%
Protein
21.15g
12.79g
17%
Vitamin B3
3.618mg
0.906mg
17%
Potassium
733mg
210mg
15%
Iron
3.71mg
2.49mg
15%
Saturated fat
3.802g
1.025g
13%
Vitamin B1
0.205mg
0.098mg
9%
Fructose
0.11g
6g
7%
Folate
44µg
19µg
6%
Zinc
3.12mg
2.56mg
5%
Selenium
4.1µg
7µg
5%
Vitamin B6
0.137mg
0.199mg
5%
Choline
52.1mg
72.2mg
4%
Vitamin B5
0.471mg
0.337mg
3%
Vitamin B12
0µg
0.08µg
3%
Carbs
21.55g
25.37g
1%
Protein per 100 calories
3.7g
6.5g
N/A
Calories per 10 g protein
274kcal
155kcal
N/A
Weight per 100 calories
17g
51g
N/A
Unsaturated / Saturated Fat ratio
12
3.9
N/A
Net carbs
9.05g
19.97g
N/A
Sugar
4.35g
6.2g
N/A
Starch
0.72g
0%
Vitamin A
0µg
4µg
0%
Trans fat
0.015g
0g
N/A
Tryptophan
0.211mg
0.155mg
0%
Threonine
0.601mg
0.479mg
0%
Isoleucine
0.751mg
0.508mg
0%
Leucine
1.473mg
0.82mg
0%
Lysine
0.568mg
0.478mg
0%
Methionine
0.157mg
0.129mg
0%
Phenylalanine
1.132mg
0.486mg
0%
Valine
0.855mg
0.547mg
0%
Histidine
0.539mg
0.243mg
0%
Omega-3 - ALA
0.003g
N/A
Omega-6 - Eicosadienoic acid
0.002g
0g
N/A
Omega-6 - Linoleic acid
12.32g
N/A
Macronutrient Comparison
Macronutrient breakdown side-by-side comparison
2
21%
50%
22%
4%
3%
Protein:
21.15 g
Fats:
49.93 g
Carbs:
21.55 g
Water:
4.41 g
Other:
2.96 g
3
13%
6%
25%
43%
13%
Protein:
12.79 g
Fats:
6.01 g
Carbs:
25.37 g
Water:
43.02 g
Other:
12.81 g
Contains
more
Protein Protein
+65.4%
Contains
more
Fats Fats
+730.8%
Contains
more
Carbs Carbs
+17.7%
Contains
more
Water Water
+875.5%
Contains
more
Other Other
+332.8%
Fat Type Comparison
Fat type breakdown side-by-side comparison
2
8%
66%
26%
Saturated fat:
Sat. Fat
3.802 g
Monounsaturated fat:
Mono. Fat
31.551 g
Polyunsaturated fat:
Poly. Fat
12.329 g
1
20%
22%
57%
Saturated fat:
Sat. Fat
1.025 g
Monounsaturated fat:
Mono. Fat
1.118 g
Polyunsaturated fat:
Poly. Fat
2.884 g
Contains
more
Mono. Fat Monounsaturated fat
+2722.1%
Contains
more
Poly. Fat Polyunsaturated fat
+327.5%
Contains
less
Sat. Fat Saturated fat
-73%
Carbohydrate type comparison
Carbohydrate type breakdown side-by-side comparison
4
14%
78%
3%
2%
Starch:
0.72 g
Sucrose:
3.95 g
Glucose:
0.17 g
Fructose:
0.11 g
Lactose:
0 g
Maltose:
0.04 g
Galactose:
0.07 g
2
97%
3%
Starch:
0 g
Sucrose:
0 g
Glucose:
0 g
Fructose:
6 g
Lactose:
0 g
Maltose:
0.2 g
Galactose:
0 g
Contains
more
Starch Starch
+∞%
Contains
more
Sucrose Sucrose
+∞%
Contains
more
Glucose Glucose
+∞%
Contains
more
Galactose Galactose
+∞%
Contains
more
Fructose Fructose
+5354.5%
Contains
more
Maltose Maltose
+400%