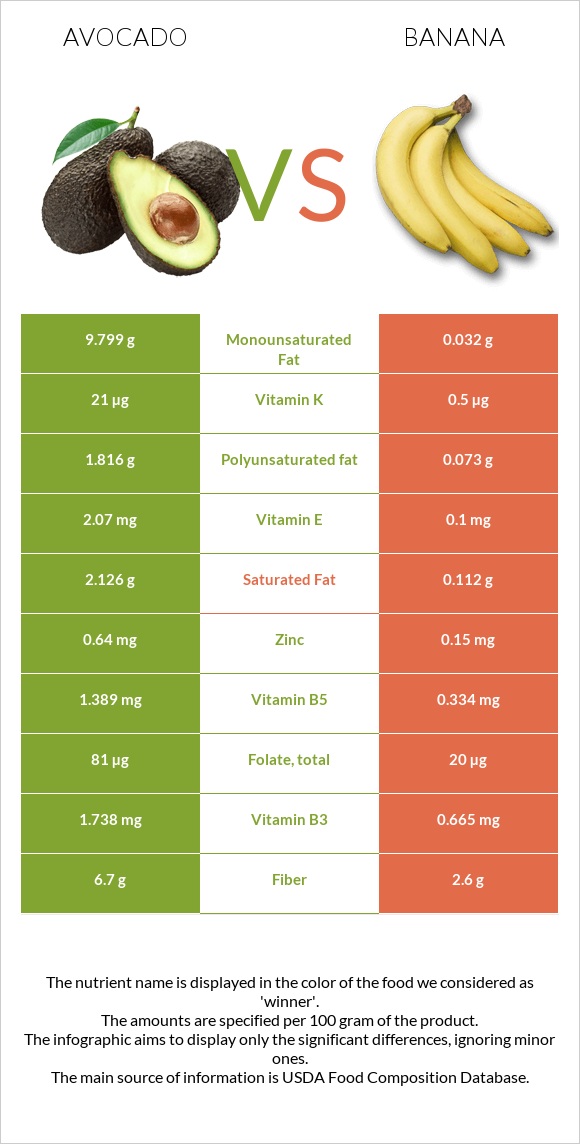
What are the differences between avocados and bananas? Avocados are higher in vitamin B5, vitamin K, fiber, folate, vitamin E, copper, and vitamin B3, yet bananas are higher in vitamin B6 and manganese. Avocados' daily need coverage for vitamin B5 is 21% more. Avocados have 42 times more vitamin K than bananas. While avocados have 21µg of vitamin K, bananas have only 0.5µg. The amount of saturated fat in bananas is lower. We used Avocados, raw, all commercial varieties and Bananas, raw types in this article.
Infographic
Mineral Comparison
Mineral comparison score is based on the number of minerals by which one or the other food is richer. The "coverage" charts below show how much of the daily needs can be covered by 300 grams of the food.
6
100 g
300 g
1 cup, sliced - 146g 1 cup, cubes - 150g 1 avocado, NS as to Florida or California - 201g 1 cup, pureed - 230g
Magnesium
Magnesium
Calcium
Calcium
Potassium
Potassium
Iron
Iron
Copper
Copper
Zinc
Zinc
Phosphorus
Phosphorus
Sodium
Sodium
Manganese
Manganese
Selenium
Selenium
21%
3.6%
43%
21%
63%
17%
22%
0.91%
19%
2.2%
3
100 g
300 g
1 extra small (less than 6" long) - 81g 1 small (6" to 6-7/8" long) - 101g 1 medium (7" to 7-7/8" long) - 118g 1 NLEA serving - 126g 1 large (8" to 8-7/8" long) - 136g 1 cup, sliced - 150g 1 extra large (9" or longer) - 152g 1 cup, mashed - 225g
Magnesium
Magnesium
Calcium
Calcium
Potassium
Potassium
Iron
Iron
Copper
Copper
Zinc
Zinc
Phosphorus
Phosphorus
Sodium
Sodium
Manganese
Manganese
Selenium
Selenium
19%
1.5%
32%
9.8%
26%
4.1%
9.4%
0.13%
35%
5.5%
Vitamin Comparison
Vitamin comparison score is based on the number of vitamins by which one or the other food is richer. The "coverage" charts below show how much of the daily needs can be covered by 300 grams of the food.
9
100 g
300 g
1 cup, sliced - 146g 1 cup, cubes - 150g 1 avocado, NS as to Florida or California - 201g 1 cup, pureed - 230g
Vitamin C
Vit. C
Vitamin D
Vit. D
Vitamin A
Vit. A
Vitamin E
Vit. E
Vitamin B1
Vit. B1
Vitamin B2
Vit. B2
Vitamin B3
Vit. B3
Vitamin B5
Vit. B5
Vitamin B6
Vit. B6
Vitamin B12
Vit. B12
Vitamin K
Vit. K
Folate
Folate
33%
0%
2.3%
41%
17%
30%
33%
83%
59%
0%
53%
61%
1
100 g
300 g
1 extra small (less than 6" long) - 81g 1 small (6" to 6-7/8" long) - 101g 1 medium (7" to 7-7/8" long) - 118g 1 NLEA serving - 126g 1 large (8" to 8-7/8" long) - 136g 1 cup, sliced - 150g 1 extra large (9" or longer) - 152g 1 cup, mashed - 225g
Vitamin C
Vit. C
Vitamin D
Vit. D
Vitamin A
Vit. A
Vitamin E
Vit. E
Vitamin B1
Vit. B1
Vitamin B2
Vit. B2
Vitamin B3
Vit. B3
Vitamin B5
Vit. B5
Vitamin B6
Vit. B6
Vitamin B12
Vit. B12
Vitamin K
Vit. K
Folate
Folate
29%
0%
1%
2%
7.8%
17%
12%
20%
85%
0%
1.3%
15%
All nutrients comparison - raw data values
Nutrient
DV% diff.
Monounsaturated fat
9.799g
0.032g
24%
Fats
14.66g
0.33g
22%
Vitamin B5
1.389mg
0.334mg
21%
Vitamin K
21µg
0.5µg
17%
Fiber
6.7g
2.6g
16%
Folate
81µg
20µg
15%
Vitamin E
2.07mg
0.1mg
13%
Copper
0.19mg
0.078mg
12%
Polyunsaturated fat
1.816g
0.073g
12%
Saturated fat
2.126g
0.112g
9%
Vitamin B6
0.257mg
0.367mg
8%
Vitamin B3
1.738mg
0.665mg
7%
Manganese
0.142mg
0.27mg
6%
Fructose
0.12g
4.85g
6%
Carbs
8.53g
22.84g
5%
Calories
160kcal
89kcal
4%
Potassium
485mg
358mg
4%
Iron
0.55mg
0.26mg
4%
Zinc
0.64mg
0.15mg
4%
Phosphorus
52mg
22mg
4%
Vitamin B2
0.13mg
0.073mg
4%
Vitamin B1
0.067mg
0.031mg
3%
Protein
2g
1.09g
2%
Starch
0.11g
5.38g
2%
Vitamin C
10mg
8.7mg
1%
Calcium
12mg
5mg
1%
Selenium
0.4µg
1µg
1%
Choline
14.2mg
9.8mg
1%
Protein per 100 calories
1.3g
1.2g
N/A
Calories per 10 g protein
800kcal
817kcal
N/A
Weight per 100 calories
63g
112g
N/A
Unsaturated / Saturated Fat ratio
5.5
0.94
N/A
Net carbs
1.83g
20.24g
N/A
Magnesium
29mg
27mg
0%
Sugar
0.66g
12.23g
N/A
Sodium
7mg
1mg
0%
Vitamin A
7µg
3µg
0%
Tryptophan
0.025mg
0.009mg
0%
Threonine
0.073mg
0.028mg
0%
Isoleucine
0.084mg
0.028mg
0%
Leucine
0.143mg
0.068mg
0%
Lysine
0.132mg
0.05mg
0%
Methionine
0.038mg
0.008mg
0%
Phenylalanine
0.097mg
0.049mg
0%
Valine
0.107mg
0.047mg
0%
Histidine
0.049mg
0.077mg
0%
Omega-3 - ALA
0.111g
N/A
Omega-6 - Gamma-linoleic acid
0.015g
N/A
Macronutrient Comparison
Macronutrient breakdown side-by-side comparison
3
2%
15%
9%
73%
Protein:
2 g
Fats:
14.66 g
Carbs:
8.53 g
Water:
73.23 g
Other:
1.58 g
2
23%
75%
Protein:
1.09 g
Fats:
0.33 g
Carbs:
22.84 g
Water:
74.91 g
Other:
0.83 g
Contains
more
Protein Protein
+83.5%
Contains
more
Fats Fats
+4342.4%
Contains
more
Other Other
+90.4%
Contains
more
Carbs Carbs
+167.8%
Fat Type Comparison
Fat type breakdown side-by-side comparison
2
15%
71%
13%
Saturated fat:
Sat. Fat
2.126 g
Monounsaturated fat:
Mono. Fat
9.799 g
Polyunsaturated fat:
Poly. Fat
1.816 g
1
52%
15%
34%
Saturated fat:
Sat. Fat
0.112 g
Monounsaturated fat:
Mono. Fat
0.032 g
Polyunsaturated fat:
Poly. Fat
0.073 g
Contains
more
Mono. Fat Monounsaturated fat
+30521.9%
Contains
more
Poly. Fat Polyunsaturated fat
+2387.7%
Contains
less
Sat. Fat Saturated fat
-94.7%
Carbohydrate type comparison
Carbohydrate type breakdown side-by-side comparison
1
14%
8%
49%
16%
13%
Starch:
0.11 g
Sucrose:
0.06 g
Glucose:
0.37 g
Fructose:
0.12 g
Lactose:
0 g
Maltose:
0 g
Galactose:
0.1 g
5
31%
14%
28%
28%
Starch:
5.38 g
Sucrose:
2.39 g
Glucose:
4.98 g
Fructose:
4.85 g
Lactose:
0 g
Maltose:
0.01 g
Galactose:
0 g
Contains
more
Galactose Galactose
+∞%
Contains
more
Starch Starch
+4790.9%
Contains
more
Sucrose Sucrose
+3883.3%
Contains
more
Glucose Glucose
+1245.9%
Contains
more
Fructose Fructose
+3941.7%
Contains
more
Maltose Maltose
+∞%