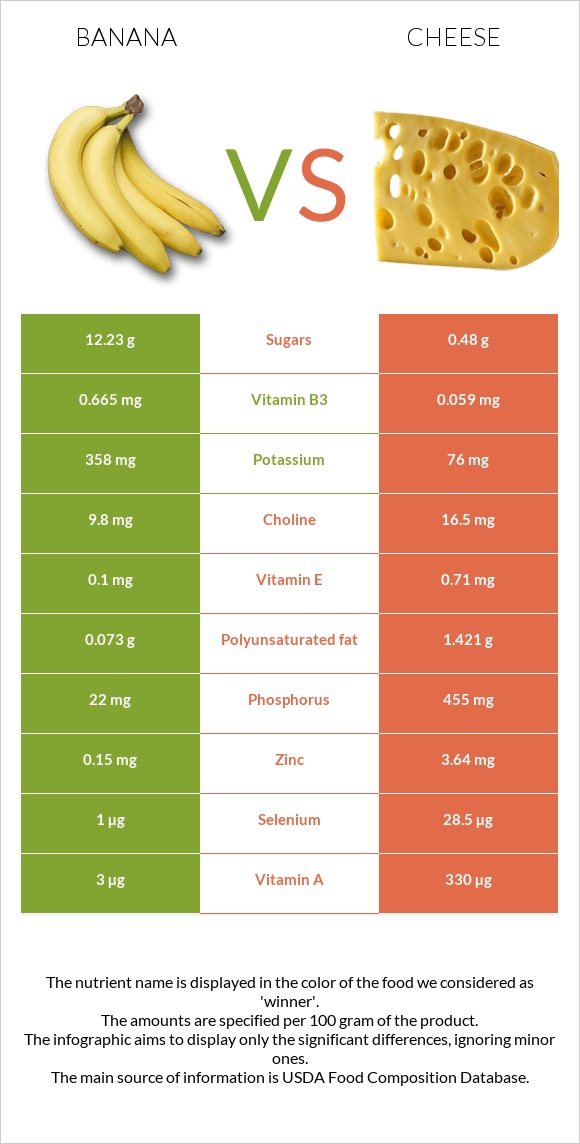
How are bananas and cheese different? Cheese has more calcium, phosphorus, selenium, vitamin B12, zinc, vitamin B2, and vitamin A than bananas. Daily need coverage for saturated fat for cheese is 94% higher. Bananas have less saturated fat. Cheese has a lower glycemic index (0) than bananas (48). Bananas, raw and Cheese, cheddar are the varieties used in this article.
Infographic
Mineral Comparison
Mineral comparison score is based on the number of minerals by which one or the other food is richer. The "coverage" charts below show how much of the daily needs can be covered by 300 grams of the food.
5
100 g
300 g
1 extra small (less than 6" long) - 81g 1 small (6" to 6-7/8" long) - 101g 1 medium (7" to 7-7/8" long) - 118g 1 NLEA serving - 126g 1 large (8" to 8-7/8" long) - 136g 1 cup, sliced - 150g 1 extra large (9" or longer) - 152g 1 cup, mashed - 225g
Magnesium
Magnesium
Calcium
Calcium
Potassium
Potassium
Iron
Iron
Copper
Copper
Zinc
Zinc
Phosphorus
Phosphorus
Sodium
Sodium
Manganese
Manganese
Selenium
Selenium
19%
1.5%
32%
9.8%
26%
4.1%
9.4%
0.13%
35%
5.5%
4
100 g
300 g
1 cubic inch - 17g 1 slice (1 oz) - 28g 1 oz - 28.35g 1 cup, shredded - 113g 1 cup, diced - 132g 1 cup, melted - 244g
Magnesium
Magnesium
Calcium
Calcium
Potassium
Potassium
Iron
Iron
Copper
Copper
Zinc
Zinc
Phosphorus
Phosphorus
Sodium
Sodium
Manganese
Manganese
Selenium
Selenium
19%
213%
6.7%
5.3%
10%
99%
195%
85%
3.5%
155%
Vitamin Comparison
Vitamin comparison score is based on the number of vitamins by which one or the other food is richer. The "coverage" charts below show how much of the daily needs can be covered by 300 grams of the food.
3
100 g
300 g
1 extra small (less than 6" long) - 81g 1 small (6" to 6-7/8" long) - 101g 1 medium (7" to 7-7/8" long) - 118g 1 NLEA serving - 126g 1 large (8" to 8-7/8" long) - 136g 1 cup, sliced - 150g 1 extra large (9" or longer) - 152g 1 cup, mashed - 225g
Vitamin C
Vit. C
Vitamin D
Vit. D
Vitamin A
Vit. A
Vitamin E
Vit. E
Vitamin B1
Vit. B1
Vitamin B2
Vit. B2
Vitamin B3
Vit. B3
Vitamin B5
Vit. B5
Vitamin B6
Vit. B6
Vitamin B12
Vit. B12
Vitamin K
Vit. K
Folate
Folate
29%
0%
1%
2%
7.8%
17%
12%
20%
85%
0%
1.3%
15%
8
100 g
300 g
1 cubic inch - 17g 1 slice (1 oz) - 28g 1 oz - 28.35g 1 cup, shredded - 113g 1 cup, diced - 132g 1 cup, melted - 244g
Vitamin C
Vit. C
Vitamin D
Vit. D
Vitamin A
Vit. A
Vitamin E
Vit. E
Vitamin B1
Vit. B1
Vitamin B2
Vit. B2
Vitamin B3
Vit. B3
Vitamin B5
Vit. B5
Vitamin B6
Vit. B6
Vitamin B12
Vit. B12
Vitamin K
Vit. K
Folate
Folate
0%
9%
110%
14%
7.3%
99%
1.1%
25%
15%
138%
6%
20%
All nutrients comparison - raw data values
Nutrient
DV% diff.
Saturated fat
0.112g
18.867g
85%
Calcium
5mg
710mg
71%
Phosphorus
22mg
455mg
62%
Fats
0.33g
33.31g
51%
Selenium
1µg
28.5µg
50%
Vitamin B12
0µg
1.1µg
46%
Protein
1.09g
22.87g
44%
Vitamin A
3µg
330µg
36%
Cholesterol
0mg
99mg
33%
Zinc
0.15mg
3.64mg
32%
Sodium
1mg
653mg
28%
Vitamin B2
0.073mg
0.428mg
27%
Vitamin B6
0.367mg
0.066mg
23%
Monounsaturated fat
0.032g
9.246g
23%
Calories
89kcal
404kcal
16%
Manganese
0.27mg
0.027mg
11%
Vitamin C
8.7mg
0mg
10%
Fiber
2.6g
0g
10%
Polyunsaturated fat
0.073g
1.421g
9%
Potassium
358mg
76mg
8%
Carbs
22.84g
3.09g
7%
Fructose
4.85g
0g
6%
Copper
0.078mg
0.03mg
5%
Vitamin E
0.1mg
0.71mg
4%
Vitamin B3
0.665mg
0.059mg
4%
Vitamin D*
0 IU
24 IU
3%
Vitamin D
0µg
0.6µg
3%
Iron
0.26mg
0.14mg
2%
Starch
5.38g
2%
Vitamin B5
0.334mg
0.41mg
2%
Vitamin K
0.5µg
2.4µg
2%
Folate
20µg
27µg
2%
Choline
9.8mg
16.5mg
1%
Protein per 100 calories
1.2g
5.7g
N/A
Calories per 10 g protein
817kcal
177kcal
N/A
Weight per 100 calories
112g
25g
N/A
Unsaturated / Saturated Fat ratio
0.94
0.57
N/A
Net carbs
20.24g
3.09g
N/A
Magnesium
27mg
27mg
0%
Sugar
12.23g
0.48g
N/A
Vitamin B1
0.031mg
0.029mg
0%
Trans fat
0g
0.917g
N/A
Tryptophan
0.009mg
0.547mg
0%
Threonine
0.028mg
1.044mg
0%
Isoleucine
0.028mg
1.206mg
0%
Leucine
0.068mg
1.939mg
0%
Lysine
0.05mg
1.025mg
0%
Methionine
0.008mg
0.547mg
0%
Phenylalanine
0.049mg
1.074mg
0%
Valine
0.047mg
1.404mg
0%
Histidine
0.077mg
0.547mg
0%
Omega-3 - EPA
0g
0.01g
N/A
Omega-3 - DHA
0g
0.001g
N/A
Omega-3 - DPA
0g
0.017g
N/A
Omega-6 - Eicosadienoic acid
0.007g
N/A
Macronutrient Comparison
Macronutrient breakdown side-by-side comparison
2
23%
75%
Protein:
1.09 g
Fats:
0.33 g
Carbs:
22.84 g
Water:
74.91 g
Other:
0.83 g
3
23%
33%
3%
37%
4%
Protein:
22.87 g
Fats:
33.31 g
Carbs:
3.09 g
Water:
37.02 g
Other:
3.71 g
Contains
more
Carbs Carbs
+639.2%
Contains
more
Water Water
+102.4%
Contains
more
Protein Protein
+1998.2%
Contains
more
Fats Fats
+9993.9%
Contains
more
Other Other
+347%
Fat Type Comparison
Fat type breakdown side-by-side comparison
1
52%
15%
34%
Saturated fat:
Sat. Fat
0.112 g
Monounsaturated fat:
Mono. Fat
0.032 g
Polyunsaturated fat:
Poly. Fat
0.073 g
2
64%
31%
5%
Saturated fat:
Sat. Fat
18.867 g
Monounsaturated fat:
Mono. Fat
9.246 g
Polyunsaturated fat:
Poly. Fat
1.421 g
Contains
less
Sat. Fat Saturated fat
-99.4%
Contains
more
Mono. Fat Monounsaturated fat
+28793.8%
Contains
more
Poly. Fat Polyunsaturated fat
+1846.6%
Carbohydrate type comparison
Carbohydrate type breakdown side-by-side comparison
5
31%
14%
28%
28%
Starch:
5.38 g
Sucrose:
2.39 g
Glucose:
4.98 g
Fructose:
4.85 g
Lactose:
0 g
Maltose:
0.01 g
Galactose:
0 g
2
54%
25%
21%
Starch:
0 g
Sucrose:
0 g
Glucose:
0.26 g
Fructose:
0 g
Lactose:
0.12 g
Maltose:
0 g
Galactose:
0.1 g
Contains
more
Starch Starch
+∞%
Contains
more
Sucrose Sucrose
+∞%
Contains
more
Glucose Glucose
+1815.4%
Contains
more
Fructose Fructose
+∞%
Contains
more
Maltose Maltose
+∞%
Contains
more
Lactose Lactose
+∞%
Contains
more
Galactose Galactose
+∞%