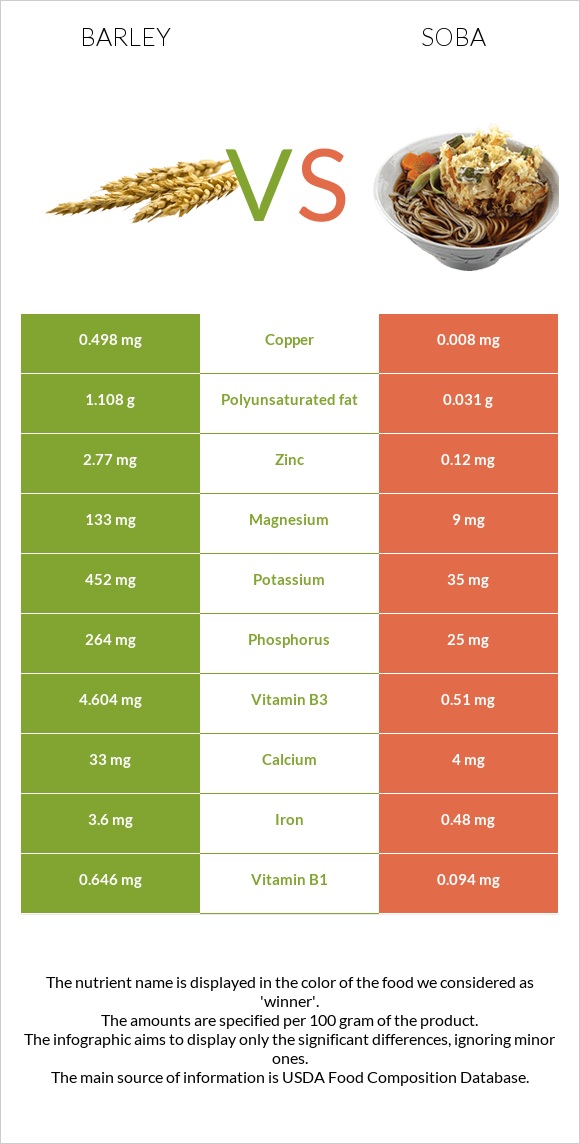
Differences between barley and soba Barley has more copper, iron, vitamin B3, zinc, and vitamin B6, while soba has more manganese. Barley's daily need coverage for copper is 11% higher. Soba contains 7 times less zinc than barley. Barley contains 0.82mg of zinc, while soba contains 0.12mg. Barley has a lower glycemic index. The glycemic index of barley is 28, while the glycemic index of soba is 46. The food types used in this comparison are Barley, pearled, cooked and Noodles, japanese, soba, cooked .
Infographic
Mineral Comparison
Mineral comparison score is based on the number of minerals by which one or the other food is richer. The "coverage" charts below show how much of the daily needs can be covered by 300 grams of the food.
9
100 g
300 g
1 cup - 157g
Magnesium
Magnesium
Calcium
Calcium
Potassium
Potassium
Iron
Iron
Copper
Copper
Zinc
Zinc
Phosphorus
Phosphorus
Sodium
Sodium
Manganese
Manganese
Selenium
Selenium
16%
3.3%
8.2%
50%
35%
22%
23%
0.39%
34%
47%
1
100 g
300 g
1 cup - 114g
Magnesium
Magnesium
Calcium
Calcium
Potassium
Potassium
Iron
Iron
Copper
Copper
Zinc
Zinc
Phosphorus
Phosphorus
Sodium
Sodium
Manganese
Manganese
Selenium
Selenium
6.4%
1.2%
3.1%
18%
2.7%
3.3%
11%
7.8%
49%
0%
Vitamin Comparison
Vitamin comparison score is based on the number of vitamins by which one or the other food is richer. The "coverage" charts below show how much of the daily needs can be covered by 300 grams of the food.
6
100 g
300 g
1 cup - 157g
Vitamin C
Vit. C
Vitamin D
Vit. D
Vitamin A
Vit. A
Vitamin E
Vit. E
Vitamin B1
Vit. B1
Vitamin B2
Vit. B2
Vitamin B3
Vit. B3
Vitamin B5
Vit. B5
Vitamin B6
Vit. B6
Vitamin B12
Vit. B12
Vitamin K
Vit. K
Folate
Folate
0%
0%
0%
0.2%
21%
14%
39%
8.1%
27%
0%
2%
12%
2
100 g
300 g
1 cup - 114g
Vitamin C
Vit. C
Vitamin D
Vit. D
Vitamin A
Vit. A
Vitamin E
Vit. E
Vitamin B1
Vit. B1
Vitamin B2
Vit. B2
Vitamin B3
Vit. B3
Vitamin B5
Vit. B5
Vitamin B6
Vit. B6
Vitamin B12
Vit. B12
Vitamin K
Vit. K
Folate
Folate
0%
0%
0%
0%
24%
6%
9.6%
14%
9.2%
0%
0%
5.3%
All nutrients comparison - raw data values
Nutrient
DV% diff.
Selenium
8.6µg
16%
Fiber
3.8g
15%
Iron
1.33mg
0.48mg
11%
Copper
0.105mg
0.008mg
11%
Vitamin B3
2.063mg
0.51mg
10%
Protein
2.26g
5.06g
6%
Zinc
0.82mg
0.12mg
6%
Vitamin B6
0.115mg
0.04mg
6%
Manganese
0.259mg
0.374mg
5%
Phosphorus
54mg
25mg
4%
Magnesium
22mg
9mg
3%
Vitamin B2
0.062mg
0.026mg
3%
Carbs
28.22g
21.44g
2%
Potassium
93mg
35mg
2%
Sodium
3mg
60mg
2%
Vitamin B5
0.135mg
0.235mg
2%
Folate
16µg
7µg
2%
Choline
13.4mg
2%
Calories
123kcal
99kcal
1%
Fats
0.44g
0.1g
1%
Calcium
11mg
4mg
1%
Vitamin B1
0.083mg
0.094mg
1%
Vitamin K
0.8µg
1%
Polyunsaturated fat
0.214g
0.031g
1%
Protein per 100 calories
1.8g
5.1g
N/A
Calories per 10 g protein
544kcal
196kcal
N/A
Weight per 100 calories
81g
101g
N/A
Net carbs
24.42g
21.44g
N/A
Sugar
0.28g
N/A
Vitamin E
0.01mg
0%
Saturated fat
0.093g
0.019g
0%
Monounsaturated fat
0.057g
0.026g
0%
Tryptophan
0.038mg
0.072mg
0%
Threonine
0.077mg
0.177mg
0%
Isoleucine
0.083mg
0.195mg
0%
Leucine
0.154mg
0.33mg
0%
Lysine
0.084mg
0.214mg
0%
Methionine
0.043mg
0.072mg
0%
Phenylalanine
0.127mg
0.217mg
0%
Valine
0.111mg
0.249mg
0%
Histidine
0.051mg
0.119mg
0%
Macronutrient Comparison
Macronutrient breakdown side-by-side comparison
2
2%
28%
69%
Protein:
2.26 g
Fats:
0.44 g
Carbs:
28.22 g
Water:
68.8 g
Other:
0.28 g
3
5%
21%
73%
Protein:
5.06 g
Fats:
0.1 g
Carbs:
21.44 g
Water:
73.01 g
Other:
0.39 g
Contains
more
Fats Fats
+340%
Contains
more
Carbs Carbs
+31.6%
Contains
more
Protein Protein
+123.9%
Contains
more
Other Other
+39.3%
Fat Type Comparison
Fat type breakdown side-by-side comparison
2
26%
16%
59%
Saturated fat:
Sat. Fat
0.093 g
Monounsaturated fat:
Mono. Fat
0.057 g
Polyunsaturated fat:
Poly. Fat
0.214 g
1
25%
34%
41%
Saturated fat:
Sat. Fat
0.019 g
Monounsaturated fat:
Mono. Fat
0.026 g
Polyunsaturated fat:
Poly. Fat
0.031 g
Contains
more
Mono. Fat Monounsaturated fat
+119.2%
Contains
more
Poly. Fat Polyunsaturated fat
+590.3%
Contains
less
Sat. Fat Saturated fat
-79.6%