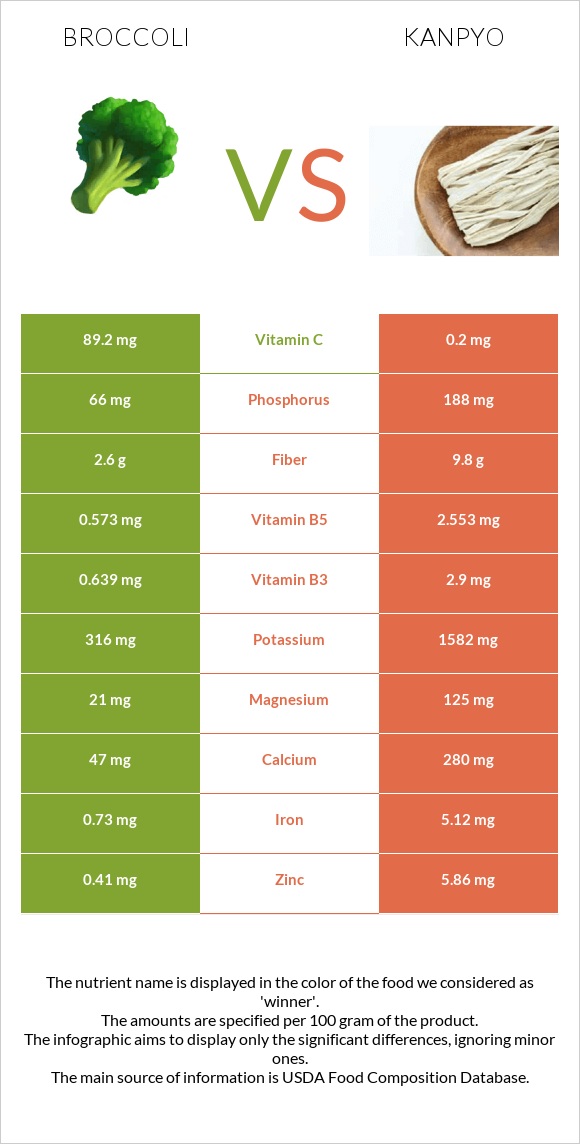
What are the differences between broccoli and kanpyo? Broccoli is higher in vitamin C, yet kanpyo is higher in iron, zinc, copper, manganese, vitamin B5, potassium, fiber, vitamin B6, and magnesium. Broccoli's daily need coverage for vitamin C is 99% more. We used Broccoli, raw and Kanpyo, (dried gourd strips) types in this article.
Infographic
Mineral Comparison
Mineral comparison score is based on the number of minerals by which one or the other food is richer. The "coverage" charts below show how much of the daily needs can be covered by 300 grams of the food.
0
100 g
300 g
1 spear (about 5" long) - 31g 0.5 cup, chopped or diced - 44g 1 cup chopped - 91g 1 NLEA serving - 148g 1 stalk - 151g 1 bunch - 608g
Magnesium
Magnesium
Calcium
Calcium
Potassium
Potassium
Iron
Iron
Copper
Copper
Zinc
Zinc
Phosphorus
Phosphorus
Sodium
Sodium
Manganese
Manganese
Selenium
Selenium
15%
14%
28%
27%
16%
11%
28%
4.3%
27%
14%
9
100 g
300 g
1 strip - 6.3g 0.5 cup - 27g
Magnesium
Magnesium
Calcium
Calcium
Potassium
Potassium
Iron
Iron
Copper
Copper
Zinc
Zinc
Phosphorus
Phosphorus
Sodium
Sodium
Manganese
Manganese
Selenium
Selenium
89%
84%
140%
192%
144%
160%
81%
2%
148%
14%
Vitamin Comparison
Vitamin comparison score is based on the number of vitamins by which one or the other food is richer. The "coverage" charts below show how much of the daily needs can be covered by 300 grams of the food.
6
100 g
300 g
1 spear (about 5" long) - 31g 0.5 cup, chopped or diced - 44g 1 cup chopped - 91g 1 NLEA serving - 148g 1 stalk - 151g 1 bunch - 608g
Vitamin C
Vit. C
Vitamin D
Vit. D
Vitamin A
Vit. A
Vitamin E
Vit. E
Vitamin B1
Vit. B1
Vitamin B2
Vit. B2
Vitamin B3
Vit. B3
Vitamin B5
Vit. B5
Vitamin B6
Vit. B6
Vitamin B12
Vit. B12
Vitamin K
Vit. K
Folate
Folate
297%
0%
10%
16%
18%
27%
12%
34%
40%
0%
254%
47%
3
100 g
300 g
1 strip - 6.3g 0.5 cup - 27g
Vitamin C
Vit. C
Vitamin D
Vit. D
Vitamin A
Vit. A
Vitamin E
Vit. E
Vitamin B1
Vit. B1
Vitamin B2
Vit. B2
Vitamin B3
Vit. B3
Vitamin B5
Vit. B5
Vitamin B6
Vit. B6
Vitamin B12
Vit. B12
Vitamin K
Vit. K
Folate
Folate
0.67%
0%
0%
0%
0%
10%
54%
153%
123%
0%
0%
46%
All nutrients comparison - raw data values
Nutrient
DV% diff.
Vitamin C
89.2mg
0.2mg
99%
Vitamin K
101.6µg
85%
Iron
0.73mg
5.12mg
55%
Zinc
0.41mg
5.86mg
50%
Copper
0.049mg
0.433mg
43%
Manganese
0.21mg
1.137mg
40%
Vitamin B5
0.573mg
2.553mg
40%
Potassium
316mg
1582mg
37%
Fiber
2.6g
9.8g
29%
Vitamin B6
0.175mg
0.532mg
27%
Magnesium
21mg
125mg
25%
Calcium
47mg
280mg
23%
Carbs
6.64g
65.03g
19%
Phosphorus
66mg
188mg
17%
Vitamin B3
0.639mg
2.9mg
14%
Protein
2.82g
8.58g
12%
Calories
34kcal
258kcal
11%
Vitamin B1
0.071mg
0mg
6%
Vitamin B2
0.117mg
0.044mg
6%
Vitamin E
0.78mg
5%
Vitamin A
31µg
3%
Choline
18.7mg
3%
Sodium
33mg
15mg
1%
Folate
63µg
61µg
1%
Polyunsaturated fat
0.038g
0.244g
1%
Fructose
0.68g
1%
Protein per 100 calories
8.3g
3.3g
N/A
Calories per 10 g protein
121kcal
301kcal
N/A
Weight per 100 calories
294g
39g
N/A
Fats
0.37g
0.56g
0%
Net carbs
4.04g
55.23g
N/A
Sugar
1.7g
N/A
Selenium
2.5µg
2.6µg
0%
Saturated fat
0.039g
0.045g
0%
Monounsaturated fat
0.011g
0.103g
0%
Tryptophan
0.033mg
0%
Threonine
0.088mg
0%
Isoleucine
0.079mg
0%
Leucine
0.129mg
0%
Lysine
0.135mg
0%
Methionine
0.038mg
0%
Phenylalanine
0.117mg
0%
Valine
0.125mg
0%
Histidine
0.059mg
0%
Macronutrient Comparison
Macronutrient breakdown side-by-side comparison
1
3%
7%
89%
Protein:
2.82 g
Fats:
0.37 g
Carbs:
6.64 g
Water:
89.3 g
Other:
0.87 g
4
9%
65%
20%
6%
Protein:
8.58 g
Fats:
0.56 g
Carbs:
65.03 g
Water:
19.97 g
Other:
5.86 g
Contains
more
Water Water
+347.2%
Contains
more
Protein Protein
+204.3%
Contains
more
Fats Fats
+51.4%
Contains
more
Carbs Carbs
+879.4%
Contains
more
Other Other
+573.6%
Fat Type Comparison
Fat type breakdown side-by-side comparison
1
44%
13%
43%
Saturated fat:
Sat. Fat
0.039 g
Monounsaturated fat:
Mono. Fat
0.011 g
Polyunsaturated fat:
Poly. Fat
0.038 g
2
11%
26%
62%
Saturated fat:
Sat. Fat
0.045 g
Monounsaturated fat:
Mono. Fat
0.103 g
Polyunsaturated fat:
Poly. Fat
0.244 g
Contains
less
Sat. Fat Saturated fat
-13.3%
Contains
more
Mono. Fat Monounsaturated fat
+836.4%
Contains
more
Poly. Fat Polyunsaturated fat
+542.1%