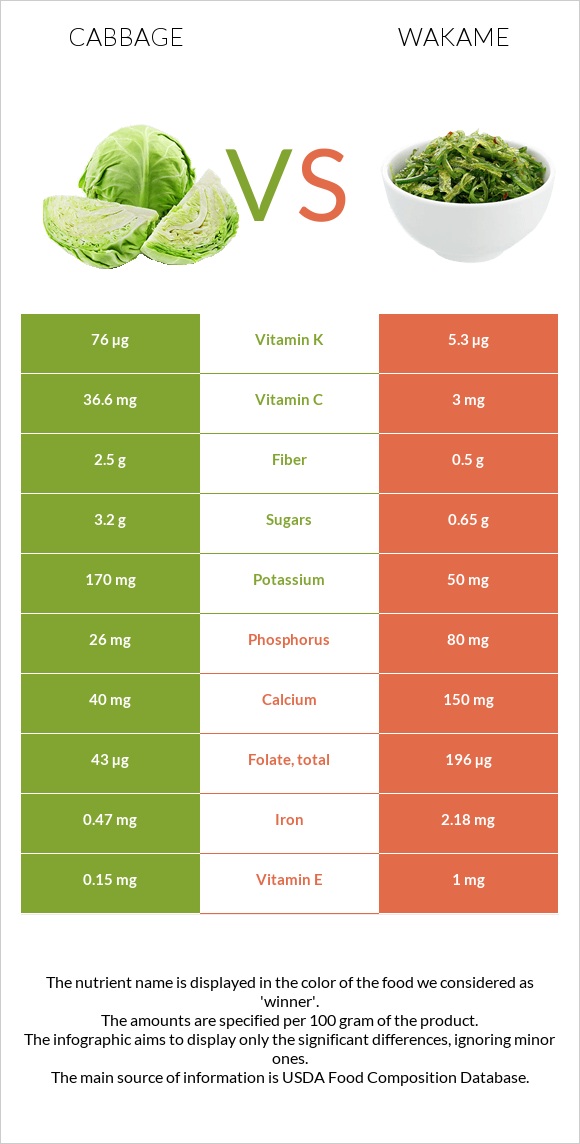
How are cabbage and wakame different? Cabbage has more vitamin K and vitamin C; however, wakame is richer in manganese, folate, copper, magnesium, iron, vitamin B2, and calcium. Cabbage covers your daily need for vitamin K, 59% more than wakame. Cabbage has 12 times more vitamin C than wakame. Cabbage has 36.6mg of vitamin C, while wakame has 3mg. Cabbage contains less sodium. Cabbage, raw and Seaweed, wakame, raw types were used in this article.
Infographic
Mineral Comparison
Mineral comparison score is based on the number of minerals by which one or the other food is richer. The "coverage" charts below show how much of the daily needs can be covered by 300 grams of the food.
2
100 g
300 g
1 leaf - 15g 1 leaf, medium - 23g 1 leaf, large - 33g 1 cup, shredded - 70g 1 cup, chopped - 89g 1 head, small (about 4-1/2" dia) - 714g 1 head, medium (about 5-3/4" dia) - 908g 1 head, large (about 7" dia) - 1248g
Magnesium
Magnesium
Calcium
Calcium
Potassium
Potassium
Iron
Iron
Copper
Copper
Zinc
Zinc
Phosphorus
Phosphorus
Sodium
Sodium
Manganese
Manganese
Selenium
Selenium
8.6%
12%
15%
18%
6.3%
4.9%
11%
2.3%
21%
1.6%
8
100 g
300 g
2 tbsp (1/8 cup) - 10g
Magnesium
Magnesium
Calcium
Calcium
Potassium
Potassium
Iron
Iron
Copper
Copper
Zinc
Zinc
Phosphorus
Phosphorus
Sodium
Sodium
Manganese
Manganese
Selenium
Selenium
76%
45%
4.4%
82%
95%
10%
34%
114%
183%
3.8%
Vitamin Comparison
Vitamin comparison score is based on the number of vitamins by which one or the other food is richer. The "coverage" charts below show how much of the daily needs can be covered by 300 grams of the food.
3
100 g
300 g
1 leaf - 15g 1 leaf, medium - 23g 1 leaf, large - 33g 1 cup, shredded - 70g 1 cup, chopped - 89g 1 head, small (about 4-1/2" dia) - 714g 1 head, medium (about 5-3/4" dia) - 908g 1 head, large (about 7" dia) - 1248g
Vitamin C
Vit. C
Vitamin D
Vit. D
Vitamin A
Vit. A
Vitamin E
Vit. E
Vitamin B1
Vit. B1
Vitamin B2
Vit. B2
Vitamin B3
Vit. B3
Vitamin B5
Vit. B5
Vitamin B6
Vit. B6
Vitamin B12
Vit. B12
Vitamin K
Vit. K
Folate
Folate
122%
0%
1.7%
3%
15%
9.2%
4.4%
13%
29%
0%
190%
32%
6
100 g
300 g
2 tbsp (1/8 cup) - 10g
Vitamin C
Vit. C
Vitamin D
Vit. D
Vitamin A
Vit. A
Vitamin E
Vit. E
Vitamin B1
Vit. B1
Vitamin B2
Vit. B2
Vitamin B3
Vit. B3
Vitamin B5
Vit. B5
Vitamin B6
Vit. B6
Vitamin B12
Vit. B12
Vitamin K
Vit. K
Folate
Folate
10%
0%
6%
20%
15%
53%
30%
42%
0.46%
0%
13%
147%
All nutrients comparison - raw data values
Nutrient
DV% diff.
Vitamin K
76µg
5.3µg
59%
Manganese
0.16mg
1.4mg
54%
Folate
43µg
196µg
38%
Vitamin C
36.6mg
3mg
37%
Sodium
18mg
872mg
37%
Copper
0.019mg
0.284mg
29%
Magnesium
12mg
107mg
23%
Iron
0.47mg
2.18mg
21%
Vitamin B2
0.04mg
0.23mg
15%
Calcium
40mg
150mg
11%
Vitamin B5
0.212mg
0.697mg
10%
Vitamin B3
0.234mg
1.6mg
9%
Vitamin B6
0.124mg
0.002mg
9%
Fiber
2.5g
0.5g
8%
Phosphorus
26mg
80mg
8%
Vitamin E
0.15mg
1mg
6%
Protein
1.28g
3.03g
4%
Potassium
170mg
50mg
4%
Zinc
0.18mg
0.38mg
2%
Fructose
1.45g
2%
Calories
25kcal
45kcal
1%
Fats
0.1g
0.64g
1%
Carbs
5.8g
9.14g
1%
Vitamin A
5µg
18µg
1%
Selenium
0.3µg
0.7µg
1%
Choline
10.7mg
13.9mg
1%
Polyunsaturated fat
0.017g
0.218g
1%
Protein per 100 calories
5.1g
6.7g
N/A
Calories per 10 g protein
195kcal
149kcal
N/A
Weight per 100 calories
400g
222g
N/A
Net carbs
3.3g
8.64g
N/A
Sugar
3.2g
0.65g
N/A
Vitamin B1
0.061mg
0.06mg
0%
Saturated fat
0.034g
0.13g
0%
Monounsaturated fat
0.017g
0.058g
0%
Tryptophan
0.011mg
0.035mg
0%
Threonine
0.035mg
0.165mg
0%
Isoleucine
0.03mg
0.087mg
0%
Leucine
0.041mg
0.257mg
0%
Lysine
0.044mg
0.112mg
0%
Methionine
0.012mg
0.063mg
0%
Phenylalanine
0.032mg
0.112mg
0%
Valine
0.042mg
0.209mg
0%
Histidine
0.022mg
0.015mg
0%
Omega-3 - EPA
0g
0.186g
N/A
Macronutrient Comparison
Macronutrient breakdown side-by-side comparison
1
6%
92%
Protein:
1.28 g
Fats:
0.1 g
Carbs:
5.8 g
Water:
92.18 g
Other:
0.64 g
4
3%
9%
80%
7%
Protein:
3.03 g
Fats:
0.64 g
Carbs:
9.14 g
Water:
79.99 g
Other:
7.2 g
Contains
more
Water Water
+15.2%
Contains
more
Protein Protein
+136.7%
Contains
more
Fats Fats
+540%
Contains
more
Carbs Carbs
+57.6%
Contains
more
Other Other
+1025%
Fat Type Comparison
Fat type breakdown side-by-side comparison
1
50%
25%
25%
Saturated fat:
Sat. Fat
0.034 g
Monounsaturated fat:
Mono. Fat
0.017 g
Polyunsaturated fat:
Poly. Fat
0.017 g
2
32%
14%
54%
Saturated fat:
Sat. Fat
0.13 g
Monounsaturated fat:
Mono. Fat
0.058 g
Polyunsaturated fat:
Poly. Fat
0.218 g
Contains
less
Sat. Fat Saturated fat
-73.8%
Contains
more
Mono. Fat Monounsaturated fat
+241.2%
Contains
more
Poly. Fat Polyunsaturated fat
+1182.4%