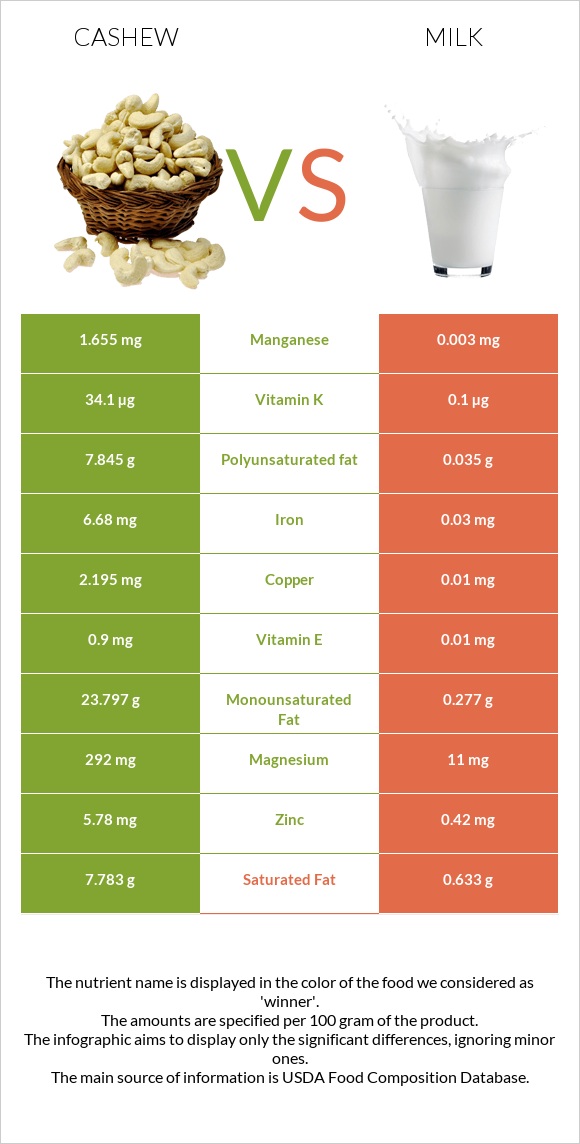
How are cashew and milk different? Cashew has more copper, iron, manganese, phosphorus, magnesium, zinc, vitamin B1, selenium, and vitamin B6 than milk. Daily need coverage for copper for cashew is 243% higher. Cashew contains 552 times more manganese than milk. While cashew contains 1.655mg of manganese, milk contains only 0.003mg. Milk has less saturated fat. Nuts, cashew nuts, raw and Milk, lowfat, fluid, 1% milkfat, with added vitamin A and vitamin D are the varieties used in this article.
Infographic
Mineral Comparison
Mineral comparison score is based on the number of minerals by which one or the other food is richer. The "coverage" charts below show how much of the daily needs can be covered by 300 grams of the food.
9
100 g
300 g
1 oz - 28.35g
Magnesium
Magnesium
Calcium
Calcium
Potassium
Potassium
Iron
Iron
Copper
Copper
Zinc
Zinc
Phosphorus
Phosphorus
Sodium
Sodium
Manganese
Manganese
Selenium
Selenium
209%
11%
58%
251%
732%
158%
254%
1.6%
216%
109%
1
100 g
300 g
1 fl oz - 30.5g 1 cup - 244g 1 quart - 976g
Magnesium
Magnesium
Calcium
Calcium
Potassium
Potassium
Iron
Iron
Copper
Copper
Zinc
Zinc
Phosphorus
Phosphorus
Sodium
Sodium
Manganese
Manganese
Selenium
Selenium
7.9%
38%
13%
1.1%
3.3%
11%
41%
5.7%
0.39%
18%
Vitamin Comparison
Vitamin comparison score is based on the number of vitamins by which one or the other food is richer. The "coverage" charts below show how much of the daily needs can be covered by 300 grams of the food.
8
100 g
300 g
1 oz - 28.35g
Vitamin C
Vit. C
Vitamin D
Vit. D
Vitamin A
Vit. A
Vitamin E
Vit. E
Vitamin B1
Vit. B1
Vitamin B2
Vit. B2
Vitamin B3
Vit. B3
Vitamin B5
Vit. B5
Vitamin B6
Vit. B6
Vitamin B12
Vit. B12
Vitamin K
Vit. K
Folate
Folate
1.7%
0%
0%
18%
106%
13%
20%
52%
96%
0%
85%
19%
4
100 g
300 g
1 fl oz - 30.5g 1 cup - 244g 1 quart - 976g
Vitamin C
Vit. C
Vitamin D
Vit. D
Vitamin A
Vit. A
Vitamin E
Vit. E
Vitamin B1
Vit. B1
Vitamin B2
Vit. B2
Vitamin B3
Vit. B3
Vitamin B5
Vit. B5
Vitamin B6
Vit. B6
Vitamin B12
Vit. B12
Vitamin K
Vit. K
Folate
Folate
0%
18%
19%
0.2%
5%
43%
1.7%
22%
8.5%
59%
0.25%
3.8%
All nutrients comparison - raw data values
Nutrient
DV% diff.
Copper
2.195mg
0.01mg
243%
Iron
6.68mg
0.03mg
83%
Manganese
1.655mg
0.003mg
72%
Phosphorus
593mg
95mg
71%
Magnesium
292mg
11mg
67%
Fats
43.85g
0.97g
66%
Monounsaturated fat
23.797g
0.277g
59%
Polyunsaturated fat
7.845g
0.035g
52%
Zinc
5.78mg
0.42mg
49%
Vitamin B1
0.423mg
0.02mg
34%
Saturated fat
7.783g
0.633g
33%
Protein
18.22g
3.37g
30%
Selenium
19.9µg
3.3µg
30%
Vitamin B6
0.417mg
0.037mg
29%
Vitamin K
34.1µg
0.1µg
28%
Calories
553kcal
42kcal
26%
Vitamin B12
0µg
0.47µg
20%
Potassium
660mg
150mg
15%
Fiber
3.3g
0g
13%
Starch
23.49g
10%
Vitamin B2
0.058mg
0.185mg
10%
Vitamin B5
0.864mg
0.361mg
10%
Calcium
37mg
125mg
9%
Carbs
30.19g
4.99g
8%
Vitamin D*
0 IU
48 IU
6%
Vitamin D
0µg
1.2µg
6%
Vitamin A
0µg
58µg
6%
Vitamin E
0.9mg
0.01mg
6%
Vitamin B3
1.062mg
0.093mg
6%
Folate
25µg
5µg
5%
Choline
17.7mg
3%
Cholesterol
0mg
5mg
2%
Vitamin C
0.5mg
0mg
1%
Sodium
12mg
44mg
1%
Protein per 100 calories
3.3g
8g
N/A
Calories per 10 g protein
304kcal
125kcal
N/A
Weight per 100 calories
18g
238g
N/A
Unsaturated / Saturated Fat ratio
4.1
0.49
N/A
Net carbs
26.89g
4.99g
N/A
Sugar
5.91g
5.2g
N/A
Tryptophan
0.287mg
0.043mg
0%
Threonine
0.688mg
0.143mg
0%
Isoleucine
0.789mg
0.174mg
0%
Leucine
1.472mg
0.319mg
0%
Lysine
0.928mg
0.282mg
0%
Methionine
0.362mg
0.088mg
0%
Phenylalanine
0.951mg
0.174mg
0%
Valine
1.094mg
0.22mg
0%
Histidine
0.456mg
0.101mg
0%
Fructose
0.05g
0g
0%
Omega-3 - ALA
0.004g
N/A
Omega-6 - Linoleic acid
0.027g
N/A
Macronutrient Comparison
Macronutrient breakdown side-by-side comparison
4
18%
44%
30%
5%
3%
Protein:
18.22 g
Fats:
43.85 g
Carbs:
30.19 g
Water:
5.2 g
Other:
2.54 g
1
3%
5%
90%
Protein:
3.37 g
Fats:
0.97 g
Carbs:
4.99 g
Water:
89.92 g
Other:
0.75 g
Contains
more
Protein Protein
+440.7%
Contains
more
Fats Fats
+4420.6%
Contains
more
Carbs Carbs
+505%
Contains
more
Other Other
+238.7%
Contains
more
Water Water
+1629.2%
Fat Type Comparison
Fat type breakdown side-by-side comparison
2
20%
60%
20%
Saturated fat:
Sat. Fat
7.783 g
Monounsaturated fat:
Mono. Fat
23.797 g
Polyunsaturated fat:
Poly. Fat
7.845 g
1
67%
29%
4%
Saturated fat:
Sat. Fat
0.633 g
Monounsaturated fat:
Mono. Fat
0.277 g
Polyunsaturated fat:
Poly. Fat
0.035 g
Contains
more
Mono. Fat Monounsaturated fat
+8491%
Contains
more
Poly. Fat Polyunsaturated fat
+22314.3%
Contains
less
Sat. Fat Saturated fat
-91.9%
Carbohydrate type comparison
Carbohydrate type breakdown side-by-side comparison
4
80%
20%
Starch:
23.49 g
Sucrose:
5.81 g
Glucose:
0.05 g
Fructose:
0.05 g
Lactose:
0 g
Maltose:
0 g
Galactose:
0 g
1
100%
Starch:
0 g
Sucrose:
0 g
Glucose:
0 g
Fructose:
0 g
Lactose:
5.2 g
Maltose:
0 g
Galactose:
0 g
Contains
more
Starch Starch
+∞%
Contains
more
Sucrose Sucrose
+∞%
Contains
more
Glucose Glucose
+∞%
Contains
more
Fructose Fructose
+∞%
Contains
more
Lactose Lactose
+∞%
~equal in
Maltose
~0g
~equal in
Galactose
~0g