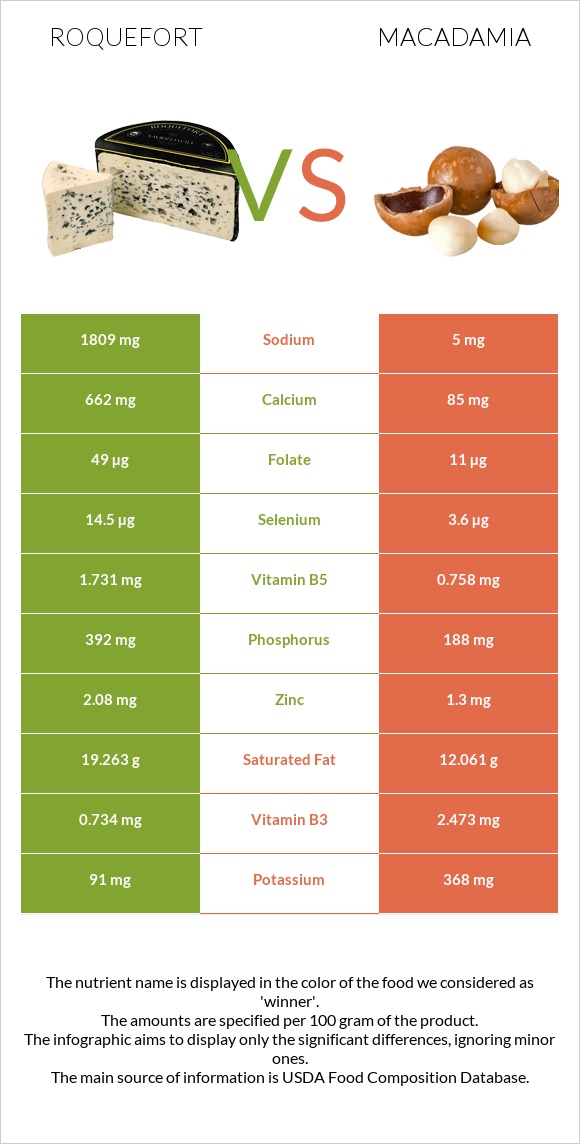
Significant differences between roquefort and macadamia Roquefort has more calcium and vitamin B2; however, macadamia is richer in manganese, vitamin B1, copper, iron, and fiber. Macadamia covers your daily manganese needs 178% more than roquefort. Roquefort has a higher glycemic index. The glycemic index of roquefort is 27, while the glycemic index of macadamia is 10. Specific food types used in this comparison are Cheese, roquefort and Nuts, macadamia nuts, raw .
Infographic
Mineral Comparison
Mineral comparison score is based on the number of minerals by which one or the other food is richer. The "coverage" charts below show how much of the daily needs can be covered by 300 grams of the food.
4
100 g
300 g
1 oz - 28.35g 1 package (3 oz) - 85g
Magnesium
Magnesium
Calcium
Calcium
Potassium
Potassium
Iron
Iron
Copper
Copper
Zinc
Zinc
Phosphorus
Phosphorus
Sodium
Sodium
Manganese
Manganese
Selenium
Selenium
21%
199%
8%
21%
11%
57%
168%
236%
3.9%
79%
6
100 g
300 g
1 oz (10-12 kernels) - 28.35g 1 cup, whole or halves - 134g
Magnesium
Magnesium
Calcium
Calcium
Potassium
Potassium
Iron
Iron
Copper
Copper
Zinc
Zinc
Phosphorus
Phosphorus
Sodium
Sodium
Manganese
Manganese
Selenium
Selenium
93%
26%
32%
138%
252%
35%
81%
0.65%
539%
20%
Vitamin Comparison
Vitamin comparison score is based on the number of vitamins by which one or the other food is richer. The "coverage" charts below show how much of the daily needs can be covered by 300 grams of the food.
5
100 g
300 g
1 oz - 28.35g 1 package (3 oz) - 85g
Vitamin C
Vit. C
Vitamin D
Vit. D
Vitamin A
Vit. A
Vitamin E
Vit. E
Vitamin B1
Vit. B1
Vitamin B2
Vit. B2
Vitamin B3
Vit. B3
Vitamin B5
Vit. B5
Vitamin B6
Vit. B6
Vitamin B12
Vit. B12
Vitamin K
Vit. K
Folate
Folate
0%
0%
98%
0%
10%
135%
14%
104%
29%
80%
0%
37%
5
100 g
300 g
1 oz (10-12 kernels) - 28.35g 1 cup, whole or halves - 134g
Vitamin C
Vit. C
Vitamin D
Vit. D
Vitamin A
Vit. A
Vitamin E
Vit. E
Vitamin B1
Vit. B1
Vitamin B2
Vit. B2
Vitamin B3
Vit. B3
Vitamin B5
Vit. B5
Vitamin B6
Vit. B6
Vitamin B12
Vit. B12
Vitamin K
Vit. K
Folate
Folate
4%
0%
0%
11%
299%
37%
46%
45%
63%
0%
0%
8.3%
All nutrients comparison - raw data values
Nutrient
DV% diff.
Manganese
0.03mg
4.131mg
178%
Monounsaturated fat
8.474g
58.877g
126%
Vitamin B1
0.04mg
1.195mg
96%
Copper
0.034mg
0.756mg
80%
Sodium
1809mg
5mg
78%
Fats
30.64g
75.77g
69%
Calcium
662mg
85mg
58%
Iron
0.56mg
3.69mg
39%
Fiber
0g
8.6g
34%
Vitamin A
294µg
0µg
33%
Vitamin B2
0.586mg
0.162mg
33%
Saturated fat
19.263g
12.061g
33%
Cholesterol
90mg
0mg
30%
Phosphorus
392mg
188mg
29%
Protein
21.54g
7.91g
27%
Vitamin B12
0.64µg
0µg
27%
Magnesium
30mg
130mg
24%
Selenium
14.5µg
3.6µg
20%
Vitamin B5
1.731mg
0.758mg
19%
Calories
369kcal
718kcal
17%
Vitamin B6
0.124mg
0.275mg
12%
Vitamin B3
0.734mg
2.473mg
11%
Folate
49µg
11µg
10%
Potassium
91mg
368mg
8%
Zinc
2.08mg
1.3mg
7%
Carbs
2g
13.82g
4%
Vitamin E
0.54mg
4%
Vitamin C
0mg
1.2mg
1%
Polyunsaturated fat
1.32g
1.502g
1%
Protein per 100 calories
5.8g
1.1g
N/A
Calories per 10 g protein
171kcal
908kcal
N/A
Weight per 100 calories
27g
14g
N/A
Unsaturated / Saturated Fat ratio
0.51
5
N/A
Net carbs
2g
5.22g
N/A
Sugar
4.57g
N/A
Starch
1.05g
0%
Tryptophan
0.303mg
0.067mg
0%
Threonine
0.965mg
0.37mg
0%
Isoleucine
1.217mg
0.314mg
0%
Leucine
2.114mg
0.602mg
0%
Lysine
1.848mg
0.018mg
0%
Methionine
0.558mg
0.023mg
0%
Phenylalanine
1.023mg
0.665mg
0%
Valine
1.614mg
0.363mg
0%
Histidine
0.602mg
0.195mg
0%
Fructose
0.07g
0%
Macronutrient Comparison
Macronutrient breakdown side-by-side comparison
3
22%
31%
2%
39%
6%
Protein:
21.54 g
Fats:
30.64 g
Carbs:
2 g
Water:
39.38 g
Other:
6.44 g
2
8%
76%
14%
Protein:
7.91 g
Fats:
75.77 g
Carbs:
13.82 g
Water:
1.36 g
Other:
1.14 g
Contains
more
Protein Protein
+172.3%
Contains
more
Water Water
+2795.6%
Contains
more
Other Other
+464.9%
Contains
more
Fats Fats
+147.3%
Contains
more
Carbs Carbs
+591%
Fat Type Comparison
Fat type breakdown side-by-side comparison
0
66%
29%
5%
Saturated fat:
Sat. Fat
19.263 g
Monounsaturated fat:
Mono. Fat
8.474 g
Polyunsaturated fat:
Poly. Fat
1.32 g
3
17%
81%
2%
Saturated fat:
Sat. Fat
12.061 g
Monounsaturated fat:
Mono. Fat
58.877 g
Polyunsaturated fat:
Poly. Fat
1.502 g
Contains
less
Sat. Fat Saturated fat
-37.4%
Contains
more
Mono. Fat Monounsaturated fat
+594.8%
Contains
more
Poly. Fat Polyunsaturated fat
+13.8%